Editor’s note. Content was provided by CD-adpaco prior to the company being acquired by Siemens in 2016.
Mixing is the art of transforming a set of distinct components into a homogenous product by blending, and it plays a critical role in many chemical, pharmaceutical and food & beverage processes. Mixed products are part of every aspect of daily life. Imagine how impoverished our lives would be without them. Or even worse, what if things didn’t mix?
Many foods, most personal-care products and all sorts of polymers, minerals, paints, coatings, biofuels and other chemical products have mixing as a crucial production step.
Control of mixing quality is critical to delivery of a uniform blend of a desired weight/volume, with consistent particle-size distribution, color, texture, reactivity or any other required attributes, and to avoid the high cost penalties associated with poor mixing.
Besides eliminating operating deficiencies, corporations today constantly push for product and process improvements, making critical the forging of strategies for faster blend times and increased mixing quality, with minimal investment.
In fact, with today’s simulation and optimization software, there’s no need to take the conventional, time-consuming and expensive route of trial-and-error physical experiments to achieve an optimal design. Instead, once engineers identify the relevant parameters, they simulate hundreds of design points quickly to identify a design that increases system efficiency and delivers competitive advantage.
Stirred tank study
Take, for example, the application of a generic stirred-tank reactor. Design objectives include minimum mixing time, maximum mixing quality, and minimizing power consumption. To get there, mechanical, electrical, and chemical component improvements may be called for.
Mechanical design parameters include, amongst others, impeller configuration, vessel size, vessel type and number of baffles. One core issue here is that there is a nonlinear relationship between changes to the design parameters and changes in performance vis-à-vis the design objectives. This can make optimizing performance a time-consuming and tedious job. To prototype system modifications at laboratory scale and then move to production capacity would be costly and time consuming.
This is where numerical design optimization adds value, as it allows autonomous, subtle design improvements in generation of an optimal stirred reactor, before physical prototypes are built. Numerical mixer optimization is a business tool that leads to profit and significant competitive advantage through a better quality product.
In a process optimization, improving one parameter may tend to degrade another, so that there is no single "optimum" design. For instance, if the goal is to both minimize mixing time and power consumption, no design offers the best value for both objectives. Likewise, at end of day, improved mixing time is obtained only by increasing power consumption.
In such scenarios, what is referred to as a "non-dominated sorting algorithm" finds the design that is best in terms of one objective, for a given value of the opposing objective. The result of a Pareto optimization study is a set of designs that satisfy this condition which is also referred to as the "non-dominated design condition."
In this example study, a series of tuning parameters for a stirred tank design and two competitive objectives were identified:
- Power number versus mixing time
- Impeller moment versus mixing quality
The main goal was to find optimal tradeoff between the competitive objectives for each case. In this regard, a multi-objective mixing study was carried out using MO-SHERPA, a set of Pareto optimum designs. Before plunging into the numerical approach, we first identify the mixing criteria as follows.
Mixing criteria
Mixing time is how long it takes to achieve a pre-defined level of mixture homogeneity. It can be difficult to identify the best way to quantify mixing performance, in terms of both time and quality. Several experimental methods evaluate mixing quality, including decolorization, electrical conductivity and pH measurements. However, some uncertainties remain as they are based on injecting a tracer into the mixture and then measuring its concentration, either visually, or with variously located probes.
For instance, mixing time required to obtain 90% homogeneity is the time needed for the fluctuations of the tracer concentration to be less than 10% of the concentration that would have been achieved with perfect mixing. However, studies have shown that this value can be significantly affected by the probe size or tracer injection location.
In addition, these methods only indicate mixing quality at a limited number of probe locations, and thus a larger number of sample points are required to get a more accurate picture, which is tedious, time-consuming, and costly.
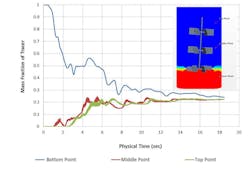
1b. Relative standard deviation method.
These shortcomings are addressed using numerical techniques, and the best approach is to use statistical analysis on the quality of mixing at every cell inside the numerical domain.
Solver software
In this regard, Siemens STAR-CCM+ defines a variety of desired mathematical formulations for measuring the mixing quality through field functions. It also allows us to define a homogeneity threshold for visualization of poor mixing areas over the mixing cycle.
We see STAR-CMM+ as more than a computational fluid dynamics (CFD) solver. It can be an entire engineering process for solving problems involving flow of fluids, or solids, heat transfer and stress.
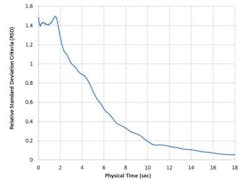
One of the numerical techniques that can be used for assessing the quality of mixing is the relative standard deviation (RSD) method, which is the ratio of standard deviation of the tracer’s mass fraction over the entire domain to its corresponding average concentration.
RSD can be formulated as follows:
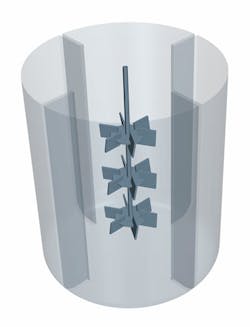
2a. Mixing tank geometry created in Star-CCM+.
Where Ci is the mass fraction of the tracer at the ith cell, C is the volume-averaged value of mass fraction of the tracer in the entire domain, and n is the number of cells. Good mixing corresponds to a low RSD value.
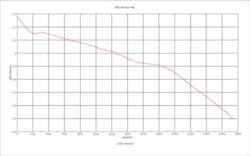
Figure 1 shows a comparison between the inert tracer method (1A), which resembles the traditional experimental technique, and the RSD method (1B), both using STAR-CCM+. As can be seen, the experimental method keeps track of the quantitative change in local concentration as a function of time, while RSD guarantees the quality of mixing over the entire domain. Thus, RSD can address the issue of the experimental approaches being spatially biased. This is one of the significant advantages of CFD over experimentation.
In this study, mixing quality is quantified using the RSD approach and the mixing time is defined as the time it takes to reach an RSD value of 0.3, which does not denote ideal mixing, but serves as a common value for "good" mixing. A process engineer can choose a stricter criteria, if need be.
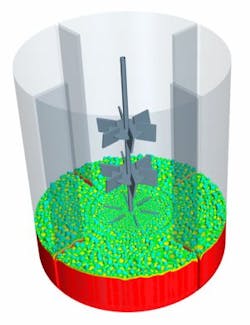
The parametric mixing tank geometry was developed in STAR-CCM+ using the 3D-CAD modeler (Figure 2A). Mixed liquid was tracked as a passive scalar which is initially at rest at the bottom of the tank (Figure 2B). A transient simulation was performed using the moving reference frame (MRF) approach. Here, competing performance objectives of 1) power number versus mixing time, and 2) impeller moment versus mixing quality, are discussed.
2b. The initial condition of tracers identified by field function.
Power number vs. mixing time
The software’s computer-aided design (CAD) modeling capabilities can be used to define as a parametric variable any design characteristic, which can then act as an input variable for optimization. In this study, seven design variables were chosen for the optimization:
- Number of impellers (2/4/3)
- Number of blades per impeller (3/9/7)
- Impeller blade angle (0/45/16)
- Impeller blade height (0.01/0.06/11)
- Impeller radius fraction (0.2/0.5/21)
- Number of baffles (2/6/5)
- Baffle height fraction (0.6/1/21)
The three numbers in (a/b/c) format show the starting point, the number of divisions for increasing the parameter, and the end point. In addition to number of division, the optimization software application, "Optimate," allows choice of specifying the increment.
For example, the increment for the number of impellers would be 1 (min=2, max=4, increment=1).
Both methods define the range within which the variables can be fine-tuned in Optimate. In this study, this number corresponds to a total of 8,149,680 variations. Covering this design space manually would be nearly impossible. Instead of running over eight million design points, Optimate uses the Sherpa optimization algorithm that can reduce the number of evaluations to a time efficient number of runs per design variable.
This algorithm learns as it goes and modifies its strategy to most effectively search the design space, significantly reducing number of runs while generating a better answer. In this case example, it took only a few days to search the design space, and complete hundreds of evaluations. The first set of optimization objectives was defined as follows:
- Minimize the power number
- Minimize the mixing time
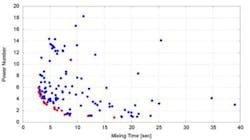
Figure 3. The results of Pareto front (red dots) show the designs forced by the optimizer to the optimal corner.
The set of outcomes resulting from the optimization is called the Pareto front. In Figure 3, the clustering of dots close to the Pareto front illustrates how the optimizer is forcing the designs towards the optimal corner which corresponds to lower values of mixing time and power number. This plot answers questions such as "What is the minimum possible power number for a specific mixing time?" or "For a specified power number, what is the minimum possible mixing time?" Answers to these questions can be worth millions of dollars in the mixing industry.
Figure 4 shows an example of CAD design, tracer’s mass fraction and RSD-time plot as calculated by Optimate for one of the design points.
Figure 4. Velocity field, Tracer’s mass fraction, CAD geometry and RSD versus time for one of the Pareto front design points.
Impeller moment vs. mixing quality
In order to study this objective, the following parameters were considered:
- Number of impellers (1/5/5)
- Impeller blade angle (0/90/19)
- Number of baffles (0/9/10)
- Baffle height (0.005 m/0.012 m/15)
It should be noted that depending on the objective, different variables can be specified. The optimization objectives were as follows:
- Maximize the volume-averaged turbulent kinetic energy (TKE)
- Minimize the moment on the impeller assembly
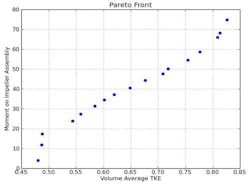
Figure 5. Pareto front from the moment of the impeller assembly versus the volume averaged TKE.
The Pareto front (Figure 5) shows the designs for which the maximum possible volume-averaged TKE is reached for a given moment on the impeller assembly.
Final words
Stirred-tank design engineers are driven by a desire to reach the highest mixing efficiency, which is influenced by competitive objectives such as mixing time versus power consumption, or moment on the impeller assembly versus turbulent kinetic energy. Because these objectives depend significantly on the geometry of the tank and the impeller, a multi-objective parametric study can identify the best overall design.
SHERPA is a robust hybrid algorithm-based optimization method provided by the Optimate plug-in, which allows for the investigation of a large design space in a short amount of time. After validating the baseline simulation against experimental data, performing the optimization study provides the best design for a predefined set of operating conditions.
CD-adapco was a computerized fluid dynamics (CFD)-focused provider of engineering software, support and services, which included computer-aided engineering services in both CFD and finite-element analysis including the technologies discussed in this article. The company was acquired by Siemens after this article was published in 2016. For more information, visit
