The time-series data journey in the era of advanced analytics
While "data analytics" has become a buzz phrase in everything from spreadsheet creation to social feeds, time-series data in process manufacturing requires fundamentally different approaches than in other arenas. The source information is dense, continuously accruing and captured in real-time from millions of sensors. This glut includes data from pumps, compressors, reactors, instruments and numerous other assets that require around-the-clock upkeep to maintain efficient production.
Organizations are struggling to keep up with modern analytical needs as experienced operators and engineers retire and fewer people are left to manage increasingly complex systems. According to LNS Research, 72% of industrial companies are investing in digital transformation and artificial intelligence (AI) tools, but fewer than 20% report having the required technological infrastructure and cross-functional organizational collaboration proficiencies needed to fully realize the benefits. These gaps make it even more essential to harness time-series data for undisrupted operations, and analysis must not only be focused on past performance, but on real-time operations and predictive trends.
This article lays out the steps required to conduct successful analysis in today’s industrial landscape.
Cleanse the data
Conducting better industrial data analysis begins with data conditioning. Real-world process data is rarely pristine as instruments drift, sensors spike and signal noise obscures meaningful trends. Even if there were perfectly calibrated sensors, there are always additional factors to account for, such as unit shutdowns and start-ups, or aging infrastructure.
The first task in any time-series investigation is addressing all the noise: smoothing data, removing outage periods and filtering outliers. Innovative advanced analytics software tools help engineers quickly assess data quality and apply cleansing techniques with just a basic understanding of the information they are observing and statistical best practices — no need for a full degree in data science.
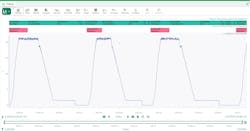
These first steps are foundational for creating accurate insights because noisy data leads to faulty conclusions (Figure 1).
Organize and structure
After the data is polished, the next challenge is scale. Behind a single pump analysis are several other similar pumps requiring the same analysis, amounting in the dozens, maybe hundreds, across a plant or enterprise.
This is why asset structure matters. Organizing data by asset type, location or process relationships — depending on the intended application — helps users standardize calculations across similar equipment, apply logic consistently (even across varied instrumentation types) and roll up key performance indicators (KPIs) for fleet-level monitoring (Figure 2).
Advanced analytics tools enable flexible scaling without years-long data projects, putting scaling tools in the hands of subject matter experts (SMEs) to develop and deploy analytics across their dominion.
Define periods of interest
Not all data is relevant all the time. This is one of the downfalls of traditional business intelligence (BI) tools — scrolling through months of data to find the 10 minutes that mattered.
In time-series analysis, context is everything. Whether dealing with a pump startup, compressor trip or batch deviation, it is important to isolate specific periods of interest to dig deeper (Figure 3).
Searching for these events can be performed using logic or pattern detection to define downtime, ramp-up or abnormal behavior windows, as well as to tag and save these periods for future analysis and reporting.
Generate insight
Once the overall data dive window is set, the true detective work begins. With cleansed data, structured assets and defined periods of interest, SMEs can examine signals over time, compare equipment performance before and after maintenance, and drill into process deviations and root causes.
AI incorporated into advanced analytics platforms, such as Seeq, can help shorten this time to value, while user-friendly tools in these types of platforms reduce the time required to learn and implement them. Ease of use promotes human-in-the-loop analysis, whereby insight creation and sharing are a product of human plus machine interaction to highlight the most valuable information in an analysis.
Alert, notify and learn
Once a problem — or an opportunity — is identified, it is critical to get the right information to the right people at the right time. Automated alerts inherent in advanced analytics platforms help notify the proper people and teams of detected events, but in large applications, notifications can get out of hand quickly. When operations take a turn for the worse, one key alert can snowball into dozens, then hundreds and eventually even thousands, depending on how the system is configured.
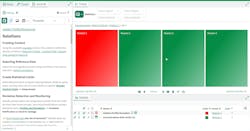
The key to managing alerts at this volume is centralizing delivery in a common monitoring environment, such as Seeq Vantage, where alerts can be labeled and triaged to manage volume (Figure 4).
These sorts of shared workspaces help teams align on what matters, while filtering out distractions. This information should be recorded for system improvements and alert delivery optimization over time.
Scale across the enterprise
Putting all the pieces together to generate insights at scale is where the return on investment ROI compounds.
One midstream oil and gas customer recently used Seeq’s Industrial Enterprise Monitoring (IEM) Suite to apply machine learning-based anomaly detection across hundreds of pumps. Instead of monitoring equipment on a one-by-one basis, the company structured datasets by asset types, applied standardized machine learning (ML) models with fallback logic and centralized alerts and visualizations in Seeq Vantage Rooms (Figure 5).
This resulted in fewer failures, earlier issue intervention, increased uptime and significant cost savings — without an army of data scientists.
Institutionalize knowledge and drive continuous improvement
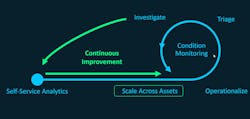
The final step on the time-series data journey is often overlooked: institutionalizing the knowledge. This is more than writing a report. The goal is to create an immortal knowledgebase with every insight, failure and win written to the organization’s memory. Critically, this also feeds AI tools.
Traditionally, SMEs did not have time to comb through rich knowledgebases to piece together key insights from numerous written reports, but AI models excel at this. With a well-defined knowledge base — including past troubleshooting experiences, process documentation and maintenance logs — AI can empower SMEs with the right information quickly so that past lessons can improve decision-making.
Empowering people, not just tech
In process manufacturing and other technologically driven industries, it is common for project focus to shift from a technical or human-centric need to the technology being implemented, but it is crucial not to deviate from the purpose for development. Effective advanced analytics solutions are centered around empowering the people who understand the processes, and placing advanced analytics in the hands of SMEs — without requiring them to become coders — enables teams to solve more problems because they can follow their curiosities.
This shift is not just about adopting new tools, but about changing how organizations think, collaborate and improve. When time-series analytics, institutional knowledge and AI are combined, organizations can unlock smarter and faster decision-making. The next era of industrial performance will be powered by data and AI, but driven by the people who know how to use it.
About the Author

Katie Pintar
Senior Analytics Engineer at Seeq Corporation
Katie Pintar is a Senior Analytics Engineer at Seeq Corporation, where she helps companies maximize value from their data. She has a process engineering background with a B.S. in chemical engineering from Montana State University. Katie has over five years of experience working for chemical manufacturers to optimize existing processes and develop processes for new materials, scaling them from the lab to pilot plant to full-scale manufacturing. She has expertise in batch and continuous processing for a wide range of chemistries.


