US chemical production expands in August
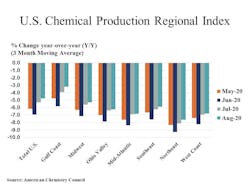
WASHINGTON, Sept. 23, 2020 /PRNewswire/ -- The U.S. Chemical Production Regional Index (U.S. CPRI) rose by 0.6 percent in August following a 1.0 percent gain in July and a 1.4 percent decline in June, according to the American Chemistry Council (ACC). During August, chemical output expanded in all regions except the West Coast, with the largest gains occurring in the Gulf Coast region. The U.S. CPRI is measured on a three-month moving average (3MMA) basis.
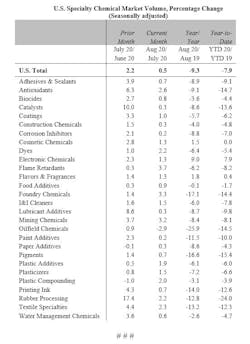
In August, chemical production continued to improve in many segments, including, plastic resins, chlor-alkali, organic chemicals, industrial gases, synthetic dyes and pigments, consumer products, synthetic rubber, manufactured fibers and fertilizers. Production moved lower in adhesives, coatings, other specialty chemicals, and crop protection chemicals.
As nearly all manufactured goods are produced using chemistry in some form, manufacturing activity is an important indicator for chemical demand. The recovery strengthened in August, with overall factory activity up by 4.1 percent on a 3MMA basis. Production increased for all key chemistry end-use industries that ACC tracks, with the strongest gains in appliances, motor vehicles, aerospace, foundries, iron and steel, refining, plastic and rubber products, tires, and apparel.
Compared with August 2019, U.S. chemical production was off by 4.8 percent on a year-over-year (Y/Y) basis, the fifteenth consecutive month of Y/Y declines, but an improvement over the past several months. Chemical production remained lower than a year ago in all regions, with the largest year -ago declines in the Northeast, Mid-Atlantic, and West Coast regions.
The chemistry industry is one of the largest industries in the United States, a $565 billion enterprise. The manufacturing sector is the largest consumer of chemical products, and 96 percent of manufactured goods are touched by chemistry. The U.S. CPRI was developed to track chemical production activity in seven regions of the United States. The U.S. CPRI is based on information from the Federal Reserve, and as such, includes monthly revisions as published by the Federal Reserve. To smooth month-to-month fluctuations, the U.S. CPRI is measured using a three-month moving average. Thus, the reading in August reflects production activity during June, July, and August.