Bridging the gap between automation and operator awareness in the process industries
Key Highlights
- Effective HMI design, guided by ISA-101 standards, enhances operator situational awareness by structuring information hierarchically and supporting quick navigation.
- Visual coding, such as color and shape, prioritizes critical information, helping operators respond swiftly to abnormal conditions and reduce reaction times.
- Alarm management, following ISA-18.2 guidelines, prevents alarm floods and ensures critical alarms are visible, reducing operator workload and operational risk.
- Implementing system standards and a formal lifecycle approach ensures consistency, safety, and efficiency in HMI and alarm system design.
- Adopting these ISA standards bridges the gap between automation and human operators, fostering proactive decision-making and safer process control.
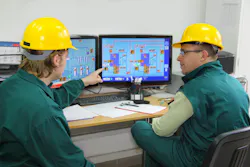
In the not-too-distant past, the operators at process plants were located close to their equipment. They could see, hear or even smell when something changed. Today, with operators isolated in remote control rooms, their primary way to stay in touch with the process is via a human machine interface (HMI).
It is therefore vital that the HMI is designed in such a way as to provide accurate and timely information: in other words, situational awareness (SA). Poor SA can contribute to, at best, a reactive operating stance where operators rely on alarms to tell them something needs to be done. Improved SA can help move to a proactive stance, potentially heading off abnormal operating conditions by effectively identifying off-normal conditions. This bridges the gap between automated systems and the humans responsible for them, reducing potential exposure to operational, safety and environmental risk.
SA can be broken down into three discrete elements: detection, diagnosis and response. The effective design of the HMI must consider all three. So how do we do this? The state of the art for HMI design is captured in the ISA-101 series of standards, specifically ANSI/ISA-101.01-2015 (ISA-101) standard “Human Machine Interfaces for Process Automation Systems.” Practical advice on applying the standard is provided in the associated technical reports ISA-TR101.01 (TR-1) and ISA-TR101.02 (TR-2). Although there is a significant amount of advice in ISA-101, there are four main areas that significantly contribute to the design of highly effective HMIs:
- System standards
- Graphic hierarchy
- Navigation
- Design principles
Developing and maintaining system standards, including the philosophy and style guide within those standards, ensures consistency in design and the management of the HMI based on a formal lifecycle model. The philosophy captures the principles to be adopted based on standards and best practices, along with the why. This is intended to be a company-wide document and platform-agnostic. Recommendations regarding the content of a philosophy document can be found in TR1, including a very useful suggested table of contents. The style guide is intended to be a platform-specific application of the philosophy.
One of the most important concepts reinforced in ISA-101 is the adoption of a formal information hierarchy. Typically, this is implemented as four levels from 1-4. Most companies have HMIs made up primarily of Level 3 (L3) and Level 4 (L4) graphics. The L3’s tend to be based on P&IDs and are not specifically based on operational tasks — this often leads to consoles with many displays required to view all the information the operator needs to maintain a level of situational awareness. Without display real estate to see all the information, the operator must rely on alarms to inform them of abnormal situations. L4’s are intended for diagnostic type of information; however, in many systems they are elevated to L3’s in the navigation hierarchy. Many companies have what they call Level 2 (L2) displays, and in some cases Level 1’s (L1), but these are often poorly implemented and configured using L3 representation, but with a reduced amount of information to allow consolidation of multiple L3’s into a single L2.
Per ISA-101, the L1 graphic is intended to provide continuous situational awareness for the whole span of control of the operator. This should mean that the operator can identify off-normal conditions before they become abnormal. For example, using a trend object to show instrument air pressure provides not just historical and current pressure, but allows the operator to perhaps predict that the pressure will drop in time to a value that causes pneumatic valves to close shutting down the process. Seeing this may allow the operator to shed users or contact the utilities operator responsible for the supply. Shutting down the process may lose production but may also expose operators to increased risk either because of the shutdown or even the required start up, especially of a complex reactor system, or a fired heater. However, it is also important that the L1 does not just support the detection of problems but also needs to orient the operator where to diagnose and make response to the issue. Typically, not being able to navigate from an L1, segmenting the L1 in such a way as to quickly identify which L2 is associated with the area of the plant where the problem is, speeds up response.
The L2s are intended to be the primary operating interface for the operator providing sufficient information for first line diagnostics as well as the most often used controls for operator response. It is also important that the key process variables that are impacted by those controls are also shown to effectively close the loop on a single graphic, again speeding up response times. There may be other controls that are used infrequently, such as during a startup or shutdown, that may not be on an L2 but remain available on the L3’s when needed. As mentioned above, data presentation at L2, and L1, may use different objects than L3. For example, a flow may be shown as a value at L3, an analog bar at L2 and a trend at L1, each chosen based on how the information is used by the operator. Additional complex objects, such as radar plots, may be used, but tuning can sometimes be difficult in processes that may not be stable or have multiple stable conditions. In some cases, to reduce cognitive workload, the power of the control system can be used to support simple objects such as a deviation bar representing a mass balance, taking multiple feed and product flows and automatically calculating a difference. Potentially adding a trend tale can add value in showing whether the difference is increasing or decreasing over time.
To take advantage of a tuned hierarchy, it is vital that navigation is designed to support quick access to the information needed in response. It is generally accepted that best practice is for any L2 to be available from anywhere within one mouse click, and L3 and L4 within a maximum of two mouse clicks. Although many navigation techniques exist, a drop-down navigation bar tends to be the most efficient, supported by in-graphic navigation within the various hierarchical peer levels. The navigation bar should be able to show all the L2’s, clicking on the top level will open the L2, however, this might also allow access to the lower levels from a drop-down list or second row of buttons for each of the L3’s under the L2. It is also a useful feature to be able to provide alarm roll up on the navigation bar to help guide the operator where to go to see an alarm in context. This may also be a feature of the alarm summary, where clicking on an alarm will open the associated graphic defined for it.
Finally, it is vital that the design principles recommended in ISA-101 and illustrated in TR-2 are followed to ensure the operator is presented in a manner that supports optimal situational awareness. In essence, it is important that information is prioritized effectively to ensure that attention is drawn immediately to the most critical. Visual coding is used to reinforce importance. So, information that is used to orient the operator, for example, a process vessel, should be the least salient, so color and shape should be chosen accordingly. On a light grey display background, a simple vessel shape, with no distracting 3-D representation, with a slightly darker grey fill, would be appropriate. A slightly darker still color for static information, such as labels, should be chosen. Moving on up through the perceptual layers, normal operating parameters, off-normal information, abnormal and finally critical information each should become more salient. For example, a critical, unacknowledged alarm is most often red and flashing. Most often alarm colors are chosen to be the most salient colors, and so they should be reserved for that use only. It is also important to look at overall color usage to again make sure the most important information is the most obvious. An example of this is the common use of a bright green for open/running indication, this color competes for the operator’s attention with the alarm colors, so if using green, consider using a darker green. It is also important to ensure that screen density and layout are considered, too much information, or clutter, will potentially overwhelm important information, slowing response time. Similarly having major process flows coming in from the left and exiting to the right and using line thickness to identify primary process flows can speed up identifying incident propagation and hence response.
All the good work of implementing the above can be significantly compromised if alarm management is out of control. If there are too many critical priority standing alarms, even the best L1 graphic will be a sea of red, and the operator will find it hard to identify changes. A large number of alarms, especially in the form of alarm floods, defined as more than 10 alarms in a 10-minute period, increases operator workload and potentially overwhelms the operator. This can lead to a situation where an important alarm is missed, resulting in the required response not being performed, further resulting in the unmitigated consequence of the abnormal situation. So how do we prevent this? For the best practices relating to alarm management, one should refer to ANSI/ISA-18.2-2016 (ISA-18.2) standard “Management of Alarm Systems for the Process Industries.” This document, along with its associated technical reports, provides a complete set of guidelines for the management of alarm systems.
Based on the standard the following should be considered:
- System standards
- Alarm performance
- Master alarm database
- Rationalization
- Design principles
Like ISA-101, this is based on a recommended formal lifecycle model, again starting with the development of an alarm philosophy as described in ISA-TR18.2.01. Executing any type of alarm initiative without a good philosophy is like playing football without knowing the rules — you are not going to be too successful.
Many companies fall into the trap of KPI chasing, often focusing too heavily on normal alarm rates and using this as a basis for alarm rationalization through bad actor resolution. Understanding performance is vital to ensure that management is effective. To this end, the standard recommends performance indicators such as normal alarm rates, priority distributions and flood magnitude and frequency.
Bad actor resolution may yield some improvements; however, sustained success requires a good basis for design and management of the alarms, including the implementation of a master alarm database. ISA-18.2 provides guidance for performing alarm rationalization, identifying causes, consequences and corrective actions, as well as determining priority. It also provides guidance on alarm configuration such as delay timers and filters. Correct configuration of individual alarms can reduce normal alarm rates; however, to impact alarm floods the standard describes advanced techniques such as conditional alarming. It also describes ways operators can interact with the system to suppress or shelve alarms. The configuration of alarms should be captured in the described master alarm database and controlled via a formal management of change process. Ideally the master alarm database can also be the source of information for operator alarm help. By following the standard alarm rates and standing alarms will be reduced to ensure that the HMI is not compromised, improving overall situational awareness.
So why use these standards? They are typically voluntary, agreed-upon guidelines that define technical specifications, safety requirements and performance criteria for products, services and processes. They represent the consensus best practices developed by a diverse group of subject matter experts. The adoption of standards such as ISA-101 and ISA-18.2, along with other ISA standards, reduce operational risk, as well as engineering costs and time. By adopting these and other standards in process industries we can effectively and consistently bridge the gap between automation and operator awareness.
About the Author
 David Lee
David Lee
Executive Board member of International Society of Automation (ISA) and chair of the ISA Standards & Practices Board
David Lee, C.Eng, FIChemE, is an Executive Board member of the International Society of Automation (ISA) and chair of the ISA Standards & Practices Board. He has nearly 40 years of industrial experience. In his early career, he held positions in automation engineering and operations management. Since then, he has worked predominantly as an operator performance consultant and is currently president of User Centered Design Services.