Drive product quality with continuous process insight
Key Highlights
- Digital twins leverage existing historian, MES, and inline data to model and optimize complex manufacturing processes in real time.
- Models are trained to identify key parameters influencing quality, enabling early detection of drifts and proactive adjustments.
- Implementation of in-run recommendations and anomaly alerts improves process capability by 25-50% and reduces material waste by up to 3%.
- Starting with available historical data allows rapid deployment of models, even with limited initial samples, accelerating ROI.
- Progression from awareness to operator assistance and eventually closed-loop control ensures human oversight while enhancing process stability.
Digitalization paired with instrumentation growth has turned the typical process plant into a data goldmine. Historians hold years of tag data, manufacturing execution systems (MES) record every batch and product change, and Industrial Internet of Things (IIoT) connectivity has diminished the cost of adding measurement points significantly. Most plants now collect data far faster than any engineering team can realistically review.
Despite the vast amount of data available, product quality is still typically evaluated in retrospect. Periodic samples may be pulled for analysis after a batch, where the results confirm whether a specification was met. However, this methodology rarely explains which changes should be made to optimize production or improve quality, and by the time the result arrives, the process has already moved on. Connectivity can provide the data required for optimization or corrections, but connectivity alone does not identify ideal changes to make in operational workflows.
Quality drifts, even on well-connected processing lines
Several conditions make quality difficult to hold, and they usually appear together. In multi-step processes, quality takes shape early — for instance, during mixing, extrusion or coating — but is measured much later (after drying or freezing). As a result, there are often delays between adjusting a setpoint and seeing its impact.
Process complexity further compounds the delay when multiple interacting characteristics and measurements influence a single quality parameter. No operator can single-handedly track so many interconnected variables while running a line. Furthermore, startups and changeovers add additional costs because every moment of output until a process meets specification produces material that may require rework or disposal.
Experience has traditionally covered the rough spots, but it is thinning as retirement continues to impact the process industries. Meanwhile, sampling limits constrain what a quality system can reveal when a small number of samples inadequately indicate running conditions over time, which can fluctuate for many reasons.
A digital twin is a structured representation of equipment or a process, assembled from data sources already in place. These sources typically include a historian for process tags, an MES for batch and product events and any inline instrument measuring composition directly. Connecting all components is routine work, with links to many historians or supervisory host systems taking just minutes to establish.
While data provides the framework for analysis, context makes digital twins useful. To provide insights, the twin must know which product is running, what operational state the line is in — such as running, offline, starting up or changing over — and which periods to exclude from analysis. When context is known, leading digital twin platforms can train separate models for each product code instead of averaging modeling among all types, so the conditions and baseline operating characteristics learned for one grade never contaminate another.
Models learn from history
Model development begins with a viability check: does the historical data contain enough variation, and do the available inputs correlate with the measured result? Answering these questions first can prevent a team from investing weeks in chasing quality parameters the data cannot support.
A trained model then reports which parameters drive the measured quality attributes and how strongly, separating long-term from short-term variation. In a beverage example, syrup flow explains most of the variation in dissolved sugar content, where an increase in flow correlates directly with higher sugar content. And in food product formulation or flavor batch processing, retention time correlates most strongly with moisture content (Figure 1).
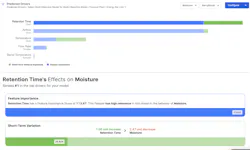
The same training run produces two additional outputs. The first is a recipe of ideal conditions for each product code — a target and an acceptable range for every input that matters, pulled from the historical runs that hit specification with the least variation. For the beverage line, this yields a specific syrup flow rate to hold.
The second is an anomaly score that compares live operation against learned conditions and flags drift as it happens, typically hours before a laboratory sample would reveal the same issue.
Dynamic in-run corrections propel autonomy
Improvement arrives in two modes. At startup — after downtime or a product change — the model supplies a fixed set of ideal setpoints, which shortens the ascent to specification and reduces material lost along the way. These values hold until the model is retrained.
During in-run operation, the model predicts where quality is heading once the process approaches a steady state, and it recommends adjustments to controllable parameters before the measurement drifts. If the model predicts moisture heading above target, for example, it may call for an increase in dryer temperature to bring the product back within specification.
Few plants move directly to closed-loop quality control, and none need to. The first step is awareness, in which an alert is routed to a technician when the anomaly score crosses a threshold or a run-to-run trend turns unfavorable, so investigation starts while the cause is still visible.
The second step is operator assistance. The recommendation appears on the operator screen alongside the quality trend and its limits, and the operator decides whether to accept it. This arrangement keeps the process under human control while accumulating evidence on whether the recommendations are advantageous (Figure 2).

Only after this stage does closed-loop control make sense, where recommendations pass directly to the control system with an override available at any time, moving operators into a supervisory role. Because each step returns value on its own, this sequence provides quick return on investment (ROI).
Results: Driving process capability and minimizing material losses
Reported outcomes for quality optimization methodologies cluster around 25-50% improvement in process capability index (CPK) and 1-3% reduction in material losses, with returns sometimes doubling. The following examples show how the same method adapted to different processes consistently yields strong results.
Consistent startups across multiple plants
A global manufacturer of premium pet nutrition products applied this quality optimization approach across multiple plants on extrusion, coating and drying lines, targeting four critical quality metrics. Models built on an existing on-premises historian and MES fed recommendations into both startup and in-run work processes, and were then integrated with the control system using TwinThread Perfect Quality — a quality optimization digital twin solution.
Following deployment, process capability rose, material losses decreased and less experienced operators began driving results previously achieved only by veterans. Automated startups reached target far more consistently than manual startups, surpassing the prior manual success rate of roughly 67%.
Focused pilot
A manufacturer of cereals and snacks took a narrower first step, piloting the same models on a single continuous line covering frying, drying and freezing. Recommendations were integrated into the startup and in-run adjustment work processes to optimize several quality metrics simultaneously, which improved quality, yield and throughput.
Reducing waste and energy use
A frozen food processor faced another combination of challenges, where quality variation was increasing waste, reducing yield and consuming unnecessary energy. By using the model to recommend ideal startup and run parameters in real time through dashboards and alerts, the team improved quality, increased yield and reduced energy intensity — the amount of energy expended per unit produced (Figure 3).

Holding material consistently near target significantly reduced required rework and subsequent reprocessing energy.
Start with available history
The data foundation required to implement machine learning is smaller than most users expect. With a small sample of quality results plus sensor data, teams can begin developing and deploying models for process optimization. Batch and MES event data improves accuracy, and inline measurements provide models with continuous signals between laboratory verification.
Digitalization in most plants has already generated the data needed to begin modeling. Process engineers are increasingly using this information to increase CPK and reduce waste, driving operational efficiency and profit margins.
About the Author
 Virag Vora
Virag Vora
Technical Solutions Engineer at TwinThread
Virag Vora is a Technical Solutions Engineer at TwinThread, where he specializes in helping manufacturers bridge the gap between massive industrial datasets and operational insights. With a background in chemical engineering and process automation, Virag has leveraged his integration experience into the next wave of technology deployments to support manufacturers in the critical work that they do. From human-centric solution development to ML-based optimization, he is dedicated to driving advancements for an industry long underserved.