How to troubleshoot pump noise & vibration

Visit Part 2 of this article by clicking here.
Often when troubleshooting a system, many people only consider the obvious choice. Common occurrence and experience sometimes blind teams to other possibilities and may lead to time and resources spent solving the wrong problem. Part 1 of this article explores a situation in which the “obvious choice” for the source of pump noise did not add up.
A backup system using three centrifugal pumps was added to a waste treatment plant in State College, Pennsylvania. The primary system consisted of a pair of centrifugal pumps running from a sewage storage tank to the discharge tank, and the backup system drew from the same storage tank and discharged into the same discharge tank. An initial sketch of the pump suction piping is shown in Figure 1.
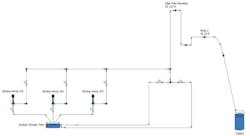
Figure 1. A section of the waste treatment system in which excessive pump noise and vibration occurred on backup pumps 1, 2 and 3
The main pumps were sized to operate at 600 gallons per minute (gpm), and the three backup pumps were sized to operate at 1,200 gpm. With the main pumps running, no issues occurred. However, any time a backup was started, pump noise and vibration occurred. As a result of the excessive vibration, the plant decided to investigate the operation of the backup pumps.
KCF Technologies Inc., a manufacturer of smart diagnostic equipment and software (including vibration monitoring) in State College, worked with the client to determine the root cause of the backup pumps’ issues. Several wireless sensors were installed close to the backup pumps’ suction nozzles, and the system was started again to analyze what was happening in the pump suction pipeline. Figure 2 shows the vibration sensor data in terms of time history [upper graph, millisecond values] and the corresponding frequency spectrum [lower graph, hertz (Hz)] when one of the three backup pumps was started.
Determining the cause of cavitation
The genesis of this joint project started when the diagnostics manufacturer was looking for a senior capstone project for Penn State students, which would demonstrate how continuous monitoring technology and piping system simulation software can be used together to identify a problem in a pumping system.
Figure 2. The dashboard of the vibration sensor data shows excessive vibration occured after 10 minutes of backup pump operation.
Initial identification of excessive vibration is an important step during diagnosis. Digging further into the root cause with system simulation allows for a total system view and efficient troubleshooting and optimization of pump performance. Together, vibration instrumentation allows for real time identification of system issues, while simulation allows for a systems approach to issue resolution. After some discussion, the client’s team members indicated that they were willing to participate in the capstone, and all involved agreed that this would be an excellent project.
The members of Penn State’s senior capstone design team, along with the members of the client’s operations staff, installed wireless monitors on the suction side of the three pumps in the system. Once the sensors were installed, the plant staff operated the system to determine the source of the pump noise and vibration.

As shown in Figure 2’s data, high-magnitude vibrations occurred within the time history for all the backup pumps. The corresponding frequency data had elevated broadband pump noise typically seen with cavitation, air entrainment or recirculation. A 20-g peak was present, indicating that rapid wear of the components would occur if the situation were left uncorrected.
Based on the results of the vibration sensor spectral data, the team believed the culprit was cavitation – likely because of inadequate net positive suction head (NPSH).
During a review of the vibration data, the following questions surfaced:
- Why did the backup pump operate for 10 minutes before vibration occurred?
- Since all the pumps shared suction on the same sewage tank, why were only the backup pumps exhibiting excessive pump noise and vibration?
- What were the suction and discharge pressure gauge readings for the operating backup pumps?
- What was the calculated value of NPSH available for the operating backup pumps?
- What was the NPSH required for the backup pump when operating within the system?
Since these points had not yet been addressed, a definite determination of the cause could not be made. NPSH calculations were subsequently performed using a system simulation of the pump suction only (Figure 1) and indicated that the NPSH available (NPSHA) at the pump suction was 39 feet, and the NPSH required (NPSHR) for the pump was only 11 feet. Therefore, the pump should not have been cavitating. Since the calculations did not match the observations, the team needed to see what was occurring in the actual system.
Building the entire piping system model
Since the piping system was vital to operations, shutting down the system to run tests to understand what was happening was not permissible. Instead, an accurate total system simulation was developed to understand the true source of the measured vibrations.
First, the students developed a model of the total piping system, both the suction and discharge sides, to gain insight regarding how the whole system operated. The students created a model with the aid of PIPE-FLO Professional from Engineered Software Inc.
Once the Penn State capstone design team had access to the piping simulation software, they easily created the model by inserting design data for all the items within the system. Figure 3 shows the connections for all the items found in the backup piping system. Note that the main pumps are not displayed on the drawing. This is because during the walk down it was determined that the primary system was not interconnected with the backup system, which, as an aside, highlights the benefit of visually verifying that the model and the system match.
Figure 3. The piping system model contains a piping schematic showing the different items within the system.
All the piping systems, regardless of size or function, are made of interconnected primary elements. The pump elements add all the hydraulic energy. The process elements are used to make or transport the product or provide the service, and the control elements improve and manage the quality of the product or service within the system. Without an understanding of how these three types of elements work together, one cannot fully comprehend how a system operates.
The pump elements consist of the three backup pumps (see Figure 3). The process elements consist of the sewage storage tank and interconnecting pipelines, along with the outlet tank. The control elements consist of the tank level switches and on/off control of the pumps to prevent the tank from overflowing when on a high level and operating the pump dry with a low tank level.
The piping system model contains the design parameters for each item included in the system. How the equipment in each element is used in making the model is described here. For the process equipment, the bottom tank elevation and liquid level in the sewage storage and outlet tanks are used to define fluid energy at the boundaries of the piping system. The pipe size, length, and valve and fitting coefficients are used to describe each pipeline. The Darcy method is used to calculate the head loss in the pipelines.
The pump elements are defined by the pump curve supplied by the manufacturer and created in accordance with multiple Hydraulic Institute (HI)/American National Standards Institute standards. Once this information is entered, the model determines the pump operation across a wide range of conditions.
The control elements in this system consisted of the level switches within the tank level indicators. When the level in the sewage storage tank is low, the pump stops to prevent it from running dry. With a high level in the tank, the pumps start to maintain the tank within the working level parameters.
Analyzing the piping system model
Once the model was created, the system was calculated with Backup Pump 101 in operation and the fluid levels in the tanks set to operational levels. The piping system model results indicated that the flow rate through the pump was in excess of 4,736 gpm, which was well outside the designed flow rate of 1,200 gpm.
Considering the pump’s NPSH, the simulation showed an NPSHA at the pump suction of 38.4 feet of fluid with a pump NPSHR of 30 feet. Initial indications revealed that the pump noise and vibration on the pump suction was not, in fact, because of cavitation. However, the simulation also calculated a system flow rate much greater than the intended design flow of the system.
Conclusion
With NPSHA values greater than the NPSHR and a calculated flow rate of more than three times the expected flow rate of 1,200 gpm, clearly more was afoot than commonly experienced pump cavitation, but what could it be?
Look for Part 2 in the December issue, which covers what occurs in this application when analyses are performed during a walkthrough to troubleshoot the pump noise and vibration using the system simulation followed by validating the result using test data.
Visit Part 2 of this article by clicking here.

Ray T. Hardee, P.E., is the chief engineer and a principle founder of Engineering Software Inc., creators of PIPE-FLO and PUMP-FLO software. The PIPE-FLO product line helps companies across many industries find hidden profit in the design and operation of their fluid piping systems through simulation software, modeling services and training opportunities. Hardee is a member of the Hydraulic Institute, American Society of Mechanical Engineers’ Energy Assessment for Pumping Systems standards committee and the International Organization for Standardization’s Pumping System Energy Assessment committee. His publications include Piping System Fundamentals and contributions to HI’s Pump Life Cycle Cost and Optimizing Piping Systems. He may be reached at [email protected].

Jeremy Frank, Ph.D., is the president and cofounder of KCF Technologies Inc., an engineering technology company that develops and integrates innovative devices for use in the emerging world of the Internet of Things. Frank earned an MBA and a doctorate in mechanical engineering from the Center for Acoustics and Vibration at Pennsylvania State University, researching smart material devices and actuators. Founded in 2000, KCF provides wireless condition monitoring sensor systems for defense and industrial markets based on vibration sensing technologies. KCF has achieved successes in multiple industries such as pulp and paper, oil and gas, automotive, and food and beverage products as well as institutional building sectors. Frank coordinates KCF’s Smart Diagnostics product line in these industries, and under his leadership revenue has grown at an average annual rate of more than 72 percent since 2000.
Engineering Software Inc. – http://www.eng-software.com
KCF Technologies Inc. – http://www.kcftech.com