Pressure budgets, hold-up maps and recovery logic
Key Highlights
- Retained line volume and weak hydraulic margins are common sources of hidden losses in process plants, often embedded in normal operations rather than obvious failures.
- Creating a hold-up map helps break down where material is retained, enabling targeted recovery or disposal decisions before cleaning or changeover steps.
- A pressure budget assesses available system pressure after losses, ensuring reliable transfer and preventing issues like cavitation or flow instability.
- Turning recovery into a controlled process involves defining entry conditions, phase detection, automatic termination, and predefined dispositions to minimize risk and variability.
- Instrumentation such as pressure sensors, flow totalizers, and phase signals support auditable, repeatable recovery sequences, improving troubleshooting and process transparency.
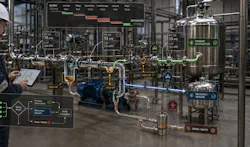
Many process plants are losing recoverable material, energy and operating time through the same overlooked mechanisms: retained line volume, weak hydraulic margin and informal recovery sequences. A disciplined retrofit approach can turn those losses into safer, measurable capacity.
The quiet losses are often designed into normal operation
In many existing process plants, the most expensive losses are not the dramatic ones. They are the recurring losses built into ordinary operation: residual product left after a transfer, long suction runs that starve pumps, over-conservative flushing, manual bleed steps during inspection and recovery practices that depend on one experienced operator knowing the route. Those losses are common in food and beverage plants, but they are not unique to food. They also appear in chemical, specialty chemical, pharmaceutical-adjacent and other liquid-processing facilities where viscosity, line hold-up, cleanliness, grade changes or pressure constraints shape day-to-day performance.
The retrofit opportunity is therefore broader than yield. When a plant recovers saleable material instead of sending it to drain, it also reduces wastewater loading, cleaning burden, thermal load, chemical use and unplanned troubleshooting. That matters in the United States because manufacturing energy use is not static: EIA preliminary 2022 MECS results reported a 6% increase in total manufacturing energy consumption between 2018 and 2022. DOE also identifies chemicals, food and beverage, cement, steel and related industrial subsectors as major energy-intensive industries that together account for more than 75% of U.S. industrial energy demand. Process engineers do not have to wait for a new plant to act on those numbers. They can start with the losses already trapped inside existing assets.
Start with a hold-up map, not a yield complaint
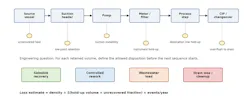
A yield complaint usually arrives as one number. A hold-up map breaks it into mechanisms that can be engineered. Every receiving system, transfer line, flowmeter spool, filter housing, heat exchanger, valve cluster, branch leg and destination line segment contains volume. At the end of a transfer, that volume has only a few possible dispositions: it becomes saleable product, controlled rework, diluted transition material, wastewater load or direct drain loss.
The calculation is simple enough to be useful on the plant floor: retained mass equals density multiplied by the sum of each line segment volume and the fraction not recovered, multiplied by annual event frequency. The value of the map is not mathematical sophistication; it is forcing a disposition decision for each retained volume before the next cleaning, changeover or inspection step begins.
Figure 1 places that calculation into an operating map. The goal is to identify where saleable product physically remains, then decide whether each retained volume should be recovered, reworked, flushed or sent to wastewater before the next sequence begins.
For food processors, that discipline aligns with a national problem. USDA and FDA continue to estimate U.S. food waste at roughly 30% to 40% of the food supply. Not all of that is in-plant manufacturing loss, but the point is clear: product that is produced, handled, pumped, heated, cooled and then discarded carries embedded material, energy, labor and sanitation cost. For nonfood processors, the same logic appears as raw-material loss, wastewater loading, solvent loss, grade contamination or cleanup time.
Build a pressure budget before blaming the pump
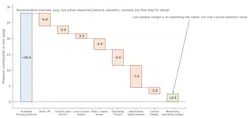
The second step is a pressure budget. A transfer system only performs as well as the pressure left after real system losses are paid. A practical expression is: available pressure minus static lift, suction friction, local losses, equipment pressure drops, discharge friction, destination backpressure and control margin equals operating margin. When the residual margin is small, the plant may see cavitation, erratic flow, low turndown, poor filling repeatability, vibration, nuisance alarms and frequent rebuilds.
The waterfall in Figure 2 is useful because it makes margin consumption visible. It separates the starting pressure from the losses imposed by elevation, friction, instruments, destination pressure and operating control margin. Once the residual margin is shown, reliability becomes an engineering balance rather than a maintenance opinion.
This is why many pump problems are actually system problems. A pump curve cannot rescue a suction line that consumes the available inlet head. The review should include source level, elevation, temperature-dependent viscosity, suction velocity, reducer orientation, strainers, elbows near the inlet, meter placement, entrained air release, control-valve location and minimum destination pressure. The same method applies whether the service is viscous dairy product, polymer solution, slurry, specialty chemical intermediate or wastewater concentrate.
The pressure budget should not be a one-time design artifact. It should be checked at minimum and maximum flow, cold and warm viscosity, full and low source level, clean and partially fouled filters, and normal and abnormal destination pressures. A retrofit that removes one avoidable restriction or shortens one bad suction run can create more reliability than replacing a pump with a larger one.
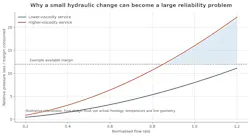
Figure 3 shows why these checks matter most in viscous service. A small increase in flow, viscosity or localized pressure drop can consume the remaining operating margin quickly, especially when the system already has limited static head or poor suction geometry.
Turn recovery into a controlled process mode
The third step is to make product recovery a controlled operating mode. Informal recovery is usually fragile. It depends on operator judgment, manual valve alignment, a visual transition cue and a shared assumption that the destination can accept the material. That may be acceptable for a one-off trial. It is not a durable manufacturing process.
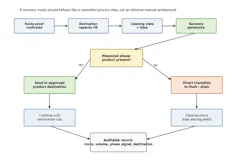
A quality-safe recovery sequence has four elements. First, entry conditions must be defined: route proof, destination capacity, correct product family, no active chemical-cleaning state and permissive pressure range. Second, the phase-detection method must be repeatable. Depending on service, that may be turbidity, conductivity, density, refractive index, mass-flow balance, temperature, pH or a validated combination of signals. Third, termination must be automatic or clearly bounded by phase signal, totalized volume, time or pressure. Fourth, disposition must be predefined: same product destination, controlled rework, transition capture or drain.
Figure 4 converts that concept into control logic. Recovery should only proceed when the route is proven, the destination is ready, cleaning is not active, the product phase is confirmed, and the sequence has an automatic termination rule. That is the difference between recovering product and moving risk downstream.
In a food plant, that structure is also a food-safety control mindset. FDA's preventive-controls framework expects process controls and sanitation controls to be defined and implemented where needed to significantly minimize or prevent hazards. A recovery sequence that creates dilution, allergen carryover, chemical intrusion or uncontrolled rework is not improvement; it is risk transfer. The engineering goal is to recover value only while protecting composition, sanitary state, traceability and product identity.
Use enough instrumentation to make the decision auditable
The instrumentation required is usually modest. Most retrofit opportunities need pressure at the right points, dependable flow totalization, verified valve position or route proof, destination level confirmation and one robust phase signal. The improvement comes from using those signals in disciplined logic. If the route is not proven, recovery does not start. If the destination has insufficient capacity, recovery does not start. If the measured phase crosses its validated interface limit, the route diverts or the sequence terminates. If the totalized displacement exceeds the allowed value, recovery stops even if another signal fails.
This approach also improves troubleshooting. Instead of arguing about whether an operator executed a step correctly, the plant has an event record: route, flow, pressure, phase signal, recovered volume, destination and termination reason. That record can support yield accounting, sanitation verification, maintenance prioritization and continuous-improvement reviews. It also helps separate true process variation from control logic gaps.
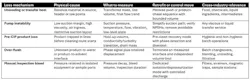
Table 1 summarizes the retrofit levers that make the framework portable across processing sectors.
A retrofit framework that travels across sectors
The strongest process-intensification projects on existing assets are often not glamorous. They do not require a greenfield plant, a new technology platform or a large automation program. They require disciplined engineering around three questions: where is material retained, where is hydraulic margin consumed and where is operator judgment carrying a control burden that should be engineered?
When those questions are answered together, the results compound. Hold-up maps reduce hidden inventory loss. Pressure budgets stabilize transfer systems and protect pumps. Recovery logic makes the gain repeatable and auditable. The same framework can be used in dairy receiving, beverage blending, chemical unloading, specialty batching, viscous product transfer, wastewater concentrate handling and pre-CIP recovery. That portability is the point. Waste, energy loss and operating risk are not isolated plant anecdotes. They are system behaviors, and system behaviors respond to structured engineering.
About the Author
 Femi Olorunnaiye
Femi Olorunnaiye
Senior process engineer at Schreiber Foods
Femi Olorunnaiye, P.E., P.Eng., PMP, is a senior process engineer at Schreiber Foods in Stephenville, Texas, specializing in hygienic process systems, equipment and hydraulic design, pump reliability, process safety, product recovery and manufacturing optimization.