Managing equipment asset reliability — in dollars and sense
Equipment asset reliability is rarely at the top of the mind of a company’s senior managers, board of directors and stakeholders. Yet, equipment asset reliability is a key determinant of the dashboard items that they keep in a constant scan: measurements of profitability, safety, environmental performance and, in some cases, customer, employee and stakeholder satisfaction. This goes beyond a simple qualitative relationship. As we will demonstrate, improved equipment asset reliability gives a company a quantifiable competitive advantage, not only with lower fixed and variable costs, but most importantly with profitability across a wider range of market conditions. In the categories of safety, environmental performance and satisfaction, too, improved reliability yields quantifiable benefits. In this article, we’ll explore how process reliability drives dashboard performance, discuss what happens when reliability goes awry and suggest some simple strategies to assure equipment asset and process reliability.
How equipment asset reliability drives profitability
In equipment asset-dependent industries, companies must optimize the production of salable product in order to increase profits. These companies typically carry a high fixed cost of operation because the plant and its equipment assets incur significant acquisition costs, and because the costly and complex equipment tends to drive companies toward large operations that pursue economies of scale. As a result, the operation is not profitable until it reaches the break-even-point (BEP) when years of production have finally met the amortized asset acquisition costs. More precisely, the BEP is the point at which the total operating margin equals the fixed cost of operation. The operating margin is calculated by subtracting variable costs of production, including raw materials, energy and direct labor, from the revenue derived from product sales.
The arithmetic seems simple — generate enough revenue from production to break even and then turn your attention to maximizing production — right? It is not quite that easy. The variable cost associated with energizing and maintaining equipment assets in the plant is not perfectly linear and the assets themselves have limits that, when exceeded, severely compromise their reliability. This is why misguided attempts to maximize production often result in suboptimal profits.
Consider the case of your personal vehicle. If you were to operate your vehicle at its top speed, say 125 miles per hour (mph) all the time, you would expect its expected reliability and usable service life to be significantly shortened as compared to driving at more sustainable speeds. Moreover, you would expect your operating costs per mile for fuel and maintenance to be much higher. Plant equipment is no different.
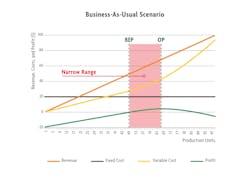
Consider a simple scenario of a company that has a business-as-usual (BAU) production profile of zero to 100 units, a per unit selling price of $1, a fixed cost of $20 and a linearized variable cost of $0.60 per unit. This organization reaches a BEP at 50 units of production. Utilizing linear math, one might assume that at 100 units, the organization would realize a profit of $20, or 20% of sales. However, just as with our speeding car example, when we push the equipment assets to the upper reaches of their operating envelope, the variable cost curve that we have assumed to be linear no longer behaves as such. These costs creep upward. Energy efficiency often suffers and maintenance costs tend to rise. In our BAU scenario, I imposed a one percent increase in variable cost compounded for production units 65 to 100. The increase in variable costs produces an optimized profit (OP) of $5.60 in the BAU scenario. Under this assumption, increasing production to the maximum value of 100 units produces an operating loss of ($5.80), much less than the theoretical profit of $20 when simple linear arithmetic is employed (Figure 1).
When we take action to improve the reliability of our equipment assets, the scenario changes significantly. By employing asset management best practices to acquire, operate, maintain and reuse/dispose of assets in accordance with ISO 55000 and affiliated standards, we can reduce the variable cost of production, especially by reducing energy cost and maintenance cost. The US Department of Energy (DOE) has determined that the chemical, petroleum refining, pulp and paper, mining and general manufacturing industries could reduce energy consumption by 22.3% simply by implementing existing best practice technologies (US DOE, 2007-2017). The DOE estimates that industrial energy consumption could be cut in half with a focus on research and development (US DOE, 2007-2017). These are astounding figures. Production assets represent a significant component of this opportunity. For example, properly sizing piping in pumping systems alone offers a tremendous energy savings opportunity (US DOE, 2005).
The opportunity to control variable maintenance costs may be even larger than the energy savings opportunity. Most industrial organizations could reduce maintenance costs by 10% to 30%. We can proactively control the root causes of machine failure and reduce maintenance costs by employing some basic precision maintenance methods to:
- Mechanically and electrically fasten machines correctly (threaded fasteners, welds, electrical connections, etc.)
- Lubricate machines properly
- Properly align mechanical components
- Achieve mechanical and electrical balance
Additionally, by routinely inspecting and monitoring the operating conditions of equipment assets, potential problems can be detected and addressed before they affect production output or escalate to more costly maintenance events. Lastly, effective notification, planning, scheduling and execution of maintenance work increases work quality and improves maintenance labor utilization, reducing maintenance costs and improving the effectiveness of maintenance actions in restoring equipment reliability.
In a reliability-improved (RI) scenario for our simple example company, I have assumed a conservative 8.3% reduction in variable production costs attributable to increased energy efficiency and reduced maintenance costs. I have also revised the assumption that variable costs increase by 1% compounded to production units 70 to 100. Well-maintained equipment can be pushed a little harder than poorly maintained equipment. These minor changes profoundly affect operational profitability. The production BEP is shifted down to the 44th unit of production for the RI scenario, as compared to the 50th unit for the BAU scenario. Moreover, profit is optimized at $11.2 at the 73rd production unit, as compared to $5.60 at the 65th unit of production (Figure 2).
In addition to improved overall profitability, the reliable equipment asset manager enjoys an important competitive advantage. Due to the lower per-unit cost of production at all production levels, the reliable asset manager is in a better position to withstand a downturn in the market. Likewise, in up markets, the reliable equipment asset manager can safely press the equipment a little harder to profit from the market opportunity. In other words, the reliable equipment asset manager is viable across a wider range of market conditions.
Fixed costs were not manipulated in this simple example exercise. However, it would be reasonable to assume that the reliable equipment asset manager would enjoy a lower fixed cost of operation. Properly maintained and operated equipment enjoy a longer service life. A large percentage of a typical plant’s fixed costs is attributable to sustaining capital. Sustaining capital represents the cost to replace equipment that is no longer maintainable. When the equipment assets last longer, less sustaining capital is required, which further enhances profitability for the reliable equipment asset manager.

Beyond profit: Reliability drives other dashboard goals
Profit is the primary objective that drives investments in reliability, however the environmental, safety and quality benefits of reliable equipment assets cannot be overlooked. Concerns about anthropogenic activity-induced climate change are not only a public opinion issue, but have become significant considerations for business and investment activity. According to the US Energy Information Administration (EIA), 32% of all energy is consumed by industrial operations (US EIA, 2020). Industrial operations in the United States require about 3.5 trillion kilowatt hours (kWh) per year (normalized from all sources), which equates to about 2.5 billion metric tons of CO2 per year. A 22% reduction, which is considered reasonable given the limitations of current technology, results in a reduction of 550 million mt of CO2. The value of ecosystem services that are compromised are difficult to value — a concept called “the tragedy of the commons.” However, experts agree that healthcare, quality of life, loss of land, increased cost for land management, increased cost of water treatment and other social costs of carbon (SCC), exact a toll of about $50 per mt of CO2. The percentage of industrial energy consumption that is reasonably reclaimable, is worth nearly $30 billion per year in ecosystem services. Improving the reliability of equipment assets can not deliver the entire prize, but it is a significant component. Also, reliable equipment is less likely to release hazardous compounds to the air, watershed and soil.
Safety is another major dashboard goal. While most industrial organizations are committed to protecting the safety of their workers and surrounding communities, many industrial disasters are directly tied to poor asset management. There is compelling evidence that reliable equipment assets are simply safer. It really comes down to the frequency and severity of failure events that produce direct consequence and indirect consequences associated with recovery from the event. Unreliable equipment simply fails more often. The law of large numbers dictates that more failure events will result in more safety events. In an operation were the reliability of the equipment assets is not effectively managed, the failure events tend to be more severe and more dangerous as a byproduct. Repairing equipment can be a risky proposition, particularly when the repair job is unplanned, or reactive. We may not have the best people, tools and materials to execute the job. On average, this scenario sets the stage for poor quality work and creates an increased risk of safety accidents.
Your next steps
Using a simple example, we have illustrated that investing in equipment asset reliability can increase plant reliability and create a competitive advantage for the organization. There also exists an opportunity to improve the organization’s environmental and safety performance with a dedicated focus on equipment asset reliability. W. Edwards Deming taught us that reliable equipment produces high quality products, which is essential for manufacturers. Shareholders benefit from higher share prices resulting from more stable profits and fewer “bad news” stories associated with safety or environmental events. Employees benefit from more stable employment and enhanced career development opportunities. And, communities benefit from the economic activity. Improving the reliability of your equipment assets provides an all-around win for your organization, your employees and the surrounding communities. However, it is not an easy win. Improving equipment asset reliability usually requires changing some cultural norms that are hard-wired in the organization.
A good place to start is to assess your strengths, weaknesses, opportunities and threats (SWOT analysis). Strengths and weaknesses are assessed utilizing a gap analysis process based upon direct observation, discussions and review of policies and procedures. Opportunities are assessed utilizing a combination of qualitative and quantitative methods. Surprisingly, thanks to the existence of benchmark data, equipment maintenance costs and energy savings opportunities are relatively easy to assess. Benefits associated with production and productivity improvements are harder to quantify in economic terms because of changing market conditions. Safety and non-energy-related benefits are still harder to quantify. Improving organizational performance by increasing the reliability of equipment assets is not usually technically challenging, but often faces a lack of execution. As such, it is important that you create an achievable, measurable and sustainable phased approach.
Drew D. Troyer is a globally recognized authority and trusted advisor on the topics of reliability engineering and engineered asset management. He has more than 30 years of experience and has published more than 300 works on the topics. Troyer is a Certified Reliability Engineer (CRE), holds BS and MBA degrees and is completing a master’s degree in Environmental Sustainability at Harvard University.
References
US Department of Energy (2005). Energy Tips – Pumping Systems: Reduce Pumping Costs through Optimum Pipe Sizing. Pumping Systems Tip Sheet #9, October. Reduce Pumping Costs through Optimum Pipe Sizing: Industrial Technologies Program (ITP) Energy Tips - Pumping Systems Tip Sheet #9 (Fact Sheet). Accessed 11 December 2020.
US Department of Energy (2007). Mining Industry Energy Bandwidth Study. Industrial Technologies Program. https://www.energy.gov/sites/prod/files/2013/11/f4/mining_bandwidth.pdf. Accessed 05 December 2020.
US Department of Energy. (2017a). Bandwidth Study on Energy Use and Potential Energy Saving Opportunities in U.S. Advanced High Strength Steels (AHSS) Manufacturing. Office of Energy Efficiency & Renewable Energy. https://www.energy.gov/eere/amo/downloads/bandwidth-study-us-advanced-high-strength-steel-manufacturing. Accessed 05 December 2020.
US Department of Energy. (2017b). Bandwidth Study on Energy Use and Potential Energy Saving Opportunities in U.S. Aluminum Manufacturing. Office of Energy Efficiency & Renewable Energy. https://www.energy.gov/eere/amo/downloads/bandwidth-study-us-aluminum-manufacturing. Accessed 05 December 2020.
US Department of Energy. (2017c). Bandwidth Study on Energy Use and Potential Energy Saving Opportunities in U.S. Cement Manufacturing. Office of Energy Efficiency & Renewable Energy. https://www.energy.gov/eere/amo/downloads/bandwidth-study-us-cement-manufacturing. Accessed 05 December 2020.
US Department of Energy. (2015a). Bandwidth Study on Energy Use and Potential Energy Saving Opportunities in U.S. Chemical Manufacturing. Office of Energy Efficiency & Renewable Energy. https://www.energy.gov/eere/amo/downloads/bandwidth-study-us-chemical-manufacturing. Accessed 05 December 2020.
US Department of Energy. (2017d). Bandwidth Study on Energy Use and Potential Energy Saving Opportunities in U.S. Food and Beverage Manufacturing. Office of Energy Efficiency & Renewable Energy. https://www.energy.gov/eere/amo/downloads/bandwidth-study-us-food-and-beverage-manufacturing. Accessed 05 December 2020.
US Department of Energy. (2017e). Bandwidth Study on Energy Use and Potential Energy Saving Opportunities in U.S. Glass Manufacturing. Office of Energy Efficiency & Renewable Energy. https://www.energy.gov/eere/amo/downloads/bandwidth-study-us-glass-manufacturing. Accessed 05 December 2020.
US Department of Energy. (2015b). Bandwidth Study on Energy Use and Potential Energy Saving Opportunities in U.S. Petroleum Refining. Office of Energy Efficiency & Renewable Energy. https://www.energy.gov/eere/amo/downloads/bandwidth-study-us-petroleum-refining. Accessed 05 December 2020.
US Department of Energy. (2017f). Bandwidth Study on Energy Use and Potential Energy Saving Opportunities in U.S. Plastics and Rubber Manufacturing. Office of Energy Efficiency & Renewable Energy. https://www.energy.gov/eere/amo/downloads/bandwidth-study-us-plastics-and-rubber-manufacturing. Accessed 05 December 2020.
US Department of Energy. (2015c). Bandwidth Study on Energy Use and Potential Energy Saving Opportunities in U.S. Pulp and Paper Manufacturing. Office of Energy Efficiency & Renewable Energy. https://www.energy.gov/eere/amo/downloads/bandwidth-study-us-pulp-and-paper-manufacturing. Accessed 05 December 2020.
US Energy Information Administration (2019). U.S. energy facts explained. https://www.eia.gov/energyexplained/us-energy-facts/. Accessed 07 December 2020.
US Energy Information Administration (2020). U.S. Energy-Related Carbon Dioxide Emissions, 2019. U.S. Energy-Related Carbon Dioxide Emissions, 2019 (eia.gov). Accessed 11 December 2020.