Dust collector emissions monitoring methods
Industrial facilities have various particulate matter monitoring methods available at their disposal today. Dust collector emissions monitoring methods include visual opacity observations, differential pressure monitoring, continuous opacity monitoring and triboelectric dust detection systems.
Historically, the choice of monitoring method depended greatly on the specific application/process and the facility location. However, in recent years changing environmental regulations have rendered several methods less viable as particulate matter emissions limits have tightened. Nevertheless, many plant operators still find themselves subject to older air permits that include grandfather clauses that allow them to continue using their older monitoring requirements.
Regardless of a facility’s current state, the future likely holds tighter regulations for particulate emissions. Further, stricter monitoring and reporting requirements will eventually apply to all facilities. Therefore, plant operators should proactively familiarize themselves with the different monitoring methods available today and consider the operational and economic advantages newer technologies offer for compliance, manufacturing and maintenance activities.
Why is monitoring of dust collection systems required?
Federal and state environmental regulations require facilities to install dust collection systems to control particulate emissions and to draft a Compliance Assurance Monitoring (CAM) plan. This is because simply installing a dust collector does not guarantee that it will capture a sufficient percentage of dust emissions. Many factors affect its performance such as proper use, correct sizing and adequate maintenance.
A CAM plan outlines how the facility plans to verify the performance of its control systems (for example, baghouses and scrubbers) during normal operation. Facilities have the responsibility to draft these plans in accordance with the local permitting authority’s regulations. While they have some leeway in crafting a monitoring plan specific to their needs, they still need to convince regulators of their plan’s feasibility for it to be approved.
In the past, some environmental engineers thought that the best strategy was to draft CAM plans around older, less accurate monitoring technologies. The thinking was that less accurate monitoring methods would make it harder for the plant to “violate” its air permit. Essentially, their reasoning was, “The less I know, the better, since I can’t get fined if my monitoring doesn’t alert me to a problem.” However, in recent years, facilities have come under tighter air pollution regulation and these older methods no longer ensure a plant will have more leeway with its emissions limits. Additionally, fines can now be applied whether monitoring was compliant or not, including violations of other standards such as the U.S. Occupational Safety and Health Administration’s combustible dust standards. Given the current regulatory requirements, crafting CAM plans around more accurate monitoring technologies that provide greater detection capabilities and more reliable emissions data has proven the superior strategy.
Dust collector emissions monitoring methods
What methods are more accurate? What are the available options? Different monitoring methods and their advantages are discussed in the following sections:
Visual observations
The simplest form of monitoring involves visually observing the stack to determine the level of visible emissions. Essentially, this means a person looks at the stack or collector outlet to see if anything is coming out of it. Many years ago, the U.S. Environmental Protection Agency codified methods 9 and 22, creating guidelines on how to conduct a visual inspection. These methods call the observer to take actions to ensure the most accurate visual measurement possible, such as where to stand, distance from the stack, sun location, time spent observing stack, weather-related adjustments and more. Once widely used, visual observations today are mostly confined to facilities that are not defined as “major sources” or fall under stricter EPA guidelines. Many facilities that were required to use visual observations have chosen to use continuous monitoring methods to increase the reliability of the monitoring and save on the labor required for these manual methods. Visual observation still serves well as a backup monitoring method should a primary system fail.
Differential pressure
In fabric filter dust collection systems, differential pressure (DP) refers to the amount of pressure loss due to an air stream passing through the fabric filters. Resistance increases as the filters become dirty and more loaded with collected dust. Eventually, when the filters become worn out and the dust begins to seep deeper into the filter fibers, the filter becomes harder to clean and thus the resistance increases, causing the differential pressure to rise in the dust collector.
For many years, measuring the DP on the dust collector (often the final air pollution control device) was used as a surrogate or substitute for direct particle concentration readings. Although indicative of a problem (rather than a direct emissions measure), a DP reading outside of normal ranges often indicates a baghouse operational issue (for example, blinded or perforated bags).
While still fundamentally sound, this approach fails to consider other causes of high DP that do not impact emissions levels. Maintenance or operational actions can lead to dust collectors maintaining a certain DP range while suffering high emissions levels at the same time. For this reason, newer air permits rarely make use of DP monitoring as the primary monitoring method for CAM plans and, much like visual observations, this provision is found primarily on older grandfathered permits. Frequently, however, DP data is one of the parametric data sets that facilities collect as part of their compliance monitoring since it is a valid parameter to show proper collector operation. Newer controls systems allow for such data to be collected and stored concurrently for analysis and reporting.
Opacity monitoring
The use of opacity monitors was a game changer in the emissions monitoring field. Compared to the alternatives previously described, opacity monitors are vastly superior in detection accuracy and reliability. They work by bouncing a beam of light (sometimes a laser) between two mirrors located on opposite sides of an exhaust outlet, i.e. stack. The meter then measures how much the light beam is weakened with each pass through the gas, thus directly measuring the opacity level of the plume. Additionally, opacity monitors provide a continuous signal output that can be connected directly to a plant’s distributed control system (DCS) or programmable logic controller (PLC) system for more effective remote monitoring and logging of emissions data for later analysis.
Several downsides to opacity monitors exist. First is the high initial and ongoing costs. Many systems start around $20,000, with initial calibration adding to the installation costs. After that, periodic recalibrations, cleanings and rebuilds over the service life add to operating costs. Second, although some instruments claim higher accuracies, the sensitivity of opacity meters is generally limited to detecting 10 percent opacity or higher. Newer emissions standards released in the last 15 years (especially Maximum Achievable Control Technology [MACT] and New Source Performance Standards [NSPS]) call for maximum emissions levels that are below 10 percent opacity. Essentially, this means that by the time the opacity meter detects any emissions, a plant would already be in violation of its air permit and have a reportable event. Even so, opacity monitors remain the most widely used continuous emissions monitoring systems (CEMS) in industrial plants.
Triboelectric detection
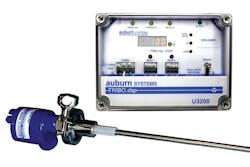
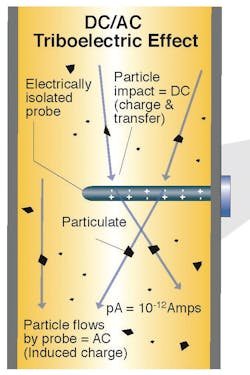
Increasingly, the most popular monitoring devices are triboelectric dust detection devices. This technology was first used for dust collection applications more than 40 years ago. In a triboelectric system, an electrically isolated metal probe is inserted into the air stream (i.e. stack), and a tiny current (pico amps) is generated when the dust particles pass nearby the probe (AC signal) or when they collide with the probe (DC signal). The two main advantages of triboelectric detection are its sensitivity and low maintenance requirements.
Triboelectric detectors are the most accurate particle concentration measurement devices used for emissions today. They can detect concentrations down to 0.000002 g/dscf (or 0.005 mg/m3), substantially more sensitive than opacity meters. This level of sensitivity means triboelectric detectors are frequently used in plants with very strict emissions limits, such as those dealing with hazardous compounds or with high combustibility. Additionally, many facilities with air permits that require fabric filter dust collector operators to carefully monitor for broken filters make use of triboelectric detectors, or bag leak detection systems due to their ability to detect bag failure in its earliest stages.
Maintenance on triboelectric detectors is significantly lower than with other methods. Once installed, the latest generation of triboelectric systems requires no initial or periodic calibration, and they also do not need regular rebuilds. In certain applications with wet or sticky dusts, the probe may require periodic cleaning or a jacketed probe can be used to ensure maximum accuracy.
Much like opacity monitors, data from triboelectric systems can be integrated with most plant DCS or PLC systems, thus eliminating the manpower needed for manually testing and inspecting that other monitoring methods require. However, the level of accuracy in detection range allows operators to use the trending emissions data to accurately predict maintenance needs. This can ease downtime planning and reduce costs by predicting when dust collector filters will need to be changed. Eliminating unplanned downtime is the highest priority in many facilities.
This freedom from calibration may surprise industry veterans who had different experiences. Older triboelectric systems made use of only part of the triboelectric spectrum, either the AC or DC signal. This is usually because of using older generations of circuitry. As such, some applications worked better than others as certain dusts and environments responded better to either the AC or DC spectrum. Some amount of calibration was required to get the older units functioning correctly and picking the wrong spectrum could at times result in less than stellar performance. However, many of these issues have since been resolved by the latest development in triboelectric detection technology such as provided by Auburn Systems. Unified digital signal processing combines the latest in digital electronics technology along with monitoring simultaneously both the AC and DC spectrum processing in a single device. This results in far greater accuracy and reliability than previous generations of the technology.
Implications to the facility
When examining the various dust collector emissions monitoring methods available today, consider the following questions to determine which is the best monitoring solution for your facility:
- Is it sensitive enough to detect emissions levels as low as my maximum emissions limit? (Especially plants under MACT standards or with broken filter monitoring requirements)
- What is the total cost of ownership, including capital expense, setup, installation, calibration, certification, regular maintenance and expected service life?
- Does it provide any additional benefits outside of compliance? (For example, operational or maintenance benefits?)
The choice of monitoring technology can be difficult to lock down. However, taking sufficient time to examine all the options and educate staff about the pros and cons of each type of system will go a long way to making your compliance requirements simpler while also improving your bottom line.
Resources
- http://leakdetection.auburnsys.com
- http://tribo.auburnsys.com/free-ebook-offer-tips-for-selecting-the-best-bag-leak-detection-system
- http://auburnsys.com/content/papers-and-reports
Earl Parker is senior vice president of sales and operations with Auburn Systems. Auburn provides monitoring solutions and has more than 35,000 installations worldwide. Auburn’s bag leak detection systems are recognized by the U.S. EPA and were the selected equipment for the development of the EPA’s Fabric Filter Guidance Document used for all MACT standards involving fabric filter collectors.


