US chemical production edged lower in March
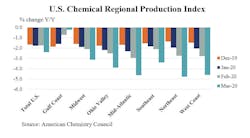
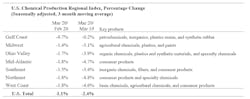
WASHINGTON, April 23, 2020 (PRNewswire) — According to the American Chemistry Council (ACC), the U.S. Chemical Production Regional Index (U.S. CPRI) edged lower by 1.1 percent in March following a 0.1 percent decline in February and flat growth in January. During March, chemical output declined across all regions. The lower level of activity is directly related to supply chain disruptions and the lockdown of much of the U.S. economy during the second half of March.
Although the U.S. Department of Homeland Security has designated chemical manufacturers as essential, production has eased in many chemical segments. Supply chains tied to personal protective equipment (PPE) and disinfection products have seen increased production, however.
Nearly all manufactured goods are produced using chemistry in some form. Thus, manufacturing activity is an important indicator for chemical production. With many factories shut down during the latter part of March, overall manufacturing activity fell by 2.2 percent on a three-month moving average (3MMA) basis, with declines across all industry sectors except computers and electronics.
Compared with March 2019, U.S. chemical production was off by 2.4 percent on a year-over-year (Y/Y) basis, the tenth and highest consecutive month of Y/Y declines. Chemical production was lower than a year ago in all regions, with the largest declines in the Northeast, Mid-Atlantic, and West Coast regions.
The chemistry industry is one of the largest industries in the United States, a $553 billion enterprise. The manufacturing sector is the largest consumer of chemical products, and 96 percent of manufactured goods are touched by chemistry. The U.S. CPRI was developed to track chemical production activity in seven regions of the United States. The U.S. CPRI is based on information from the Federal Reserve, and as such, includes monthly revisions as published by the Federal Reserve. To smooth month-to-month fluctuations, the U.S. CPRI is measured using a three-month moving average. Thus, the reading in March reflects production activity during January, February, and March.