Chemical Activity Barometer shows gain in August
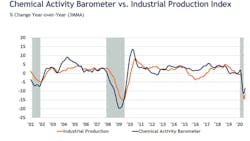
WASHINGTON, Aug. 25, 2020 (PRNewswire) — The Chemical Activity Barometer (CAB), a leading economic indicator created by the American Chemistry Council (ACC), rose by 2.5 percent in August on a three-month moving average (3MMA) basis following a 3.0 percent gain in July. On a year-over-year (Y/Y) basis, the barometer was down 6.1 percent in August.
The unadjusted data show a 1.8 percent gain in August following a 1.5 percent gain in July and a 4.1 percent gain in June. The diffusion index rose from 41 percent to 59 percent this month – the first time since January that it has been above 50 percent. The diffusion index marks the number of positive contributors relative to the total number of indicators monitored. The CAB reading for July was revised upward by 1.08 points and that for June was revised upward by 0.77 points.
"With four consecutive months of gains, the latest CAB reading is consistent with recovery in the U.S. economy, which is likely to be slow," said Kevin Swift, chief economist at ACC. "The August reading is only 5.8 percent below its pre-coronavirus level, and the indicator appears to be improving at a fairly good pace."
The CAB has four main components, each consisting of a variety of indicators: 1) production; 2) equity prices; 3) product prices; and 4) inventories and other indicators.
In August, production-related indicators were mixed. Trends in construction-related resins, pigments and related performance chemistry were mostly positive, and this sector has been strong. Resins and chemistry used in other durable goods were positive. Plastic resins used in packaging and for consumer and institutional applications showed strong gains. Performance chemistry improved, while U.S. exports were mixed. Equity prices gained and product and input prices strengthened. Inventory and other supply chain indicators were positive.
The CAB is a leading economic indicator derived from a composite index of chemical industry activity. Due to its early position in the supply chain, chemical industry activity has been found to consistently lead the U.S. economy's business cycle, and the barometer can be used to determine turning points and likely trends in the broader economy. Month-to-month movements can be volatile, so a three-month moving average of the CAB reading is provided. This provides a more consistent and illustrative picture of national economic trends.
The CAB comprises indicators relating to the production of chlorine and other alkalies, pigments, plastic resins and other selected basic industrial chemicals; chemical company stock data; hours worked in chemicals; publicly sourced, chemical price information; end-use (or customer) industry sales-to-inventories; and several broader leading economic measures (building permits and new orders). Each month, ACC provides a barometer number reflecting activity data for the current month, as well as a three-month moving average. The CAB was developed by the Economics Department at ACC.