Advanced technologies improve refining and other processes
Artificial intelligence (AI), machine learning (ML), data science and other advanced technologies have made remarkable progress in recent years, saving time and providing new insights in a variety of applications. These technologies are particularly effective when used to automatically discover problems by examining the vast amounts of data collected and stored in a typical process plant.
One of the main goals for any process manufacturer is avoiding costly downtime due to unplanned shutdowns. In petroleum refining and petrochemical facilities in particular, it is also important to minimize energy consumption for separation and other processes. Other leading goals are maintaining product quality and throughput.
Different issues can hinder progress in reaching these goals. Equipment problems require identifying root causes leading to failures and deterioration, along with failure predictions. Quality problems require investigating conditions leading to off-spec product, which can often be accomplished by visualizing various quality parameters in real-time.
In this article, these and other process manufacturing problems are examined, along with solutions relying on the intelligent application of advanced technologies.
Predicting rotating equipment problems
Production facilities in the petroleum refining and petrochemical industries are systematically maintained by periodic repair. However, especially with rotating equipment such as compressors and pumps, abrasion and deterioration of parts often occurs more quickly than expected due to differences in raw materials and environmental conditions. Predicting these types of problems and taking countermeasures can prevent costly unplanned shutdowns and reactive repair work.
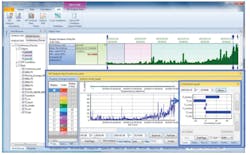
Direct abnormality detection of rotating equipment is often made using vibration and power consumption data, but simple observation of these variables is not sufficient to predict problems. A more comprehensive approach uses machine learning to detect changes among various process variables during abnormal operations — as compared to periods of normal operation — to predict failures in the early stages. The upper part of Figure 1 shows the change of process variables over time, with abnormality occurring at the right side of the upper graph.
The lower graph shows the output values of a machine learning model created using multiple process variables as inputs for the purpose of early detection of abnormality. The output value of the machine learning model rises much earlier than the raw process data in the upper graph would suggest, allowing early abnormality detection.
Root cause analysis
Performance degradation due to contamination of compressors, leakage due to corrosion of piping and tanks, clogging of equipment due to polymerization and other issues can often be detected early through root cause analysis.
This is typically done by analyzing differences between normal operations, and periods when failure has occurred, referred to as abnormal conditions. To identify the root cause, a hypothesis is made and then verified using process data. When abnormal condition data can be collected in sufficient quantities, machine learning algorithms can be applied, with results showing which process variable had a high degree of contribution (Figure 2, Approach 1).
However, an issue often arises because abnormal condition data is limited because plants of course try to avoid these states of operation In this case, operational states can be divided into several groups using a technique called clustering, with the group including the abnormal operation state examined in detail. Based on the characteristics of this group, the condition in which the possibility of abnormality is high can be derived (Figure 2, Approach 2).
There is another machine learning technique that can be used to determine what cluster is abnormal by learning the features associated with normal data and applying these learnings to a data set. When a cluster is determined to be abnormal, the process variables with high contribution can be identified and ranked.
he graph in the middle of the lower row of Figure 3 shows the degree of abnormality, and it can be seen that the degree is gradually increasing. The chart on the lower right of Figure 3 shows the contribution of each process variable causing the abnormality.
When corrosion and clogging occur in piping associated with a distillation column, separation performance decreases and production is hindered. Although it is possible to detect the situation in which the abnormality occurs by observing an increase of differential pressure or changes in many other process variables, the method described above can be used to rank the contribution of each variable to the problem, producing more useful results.
Quality prediction modeling
Product quality metrics are often not available in real time because samples must be pulled and analyzed in a lab. For example, product quality may vary due to differences in raw materials and environmental conditions, but it takes time to obtain lab results.
Therefore, a model to predict product quality in real-time based on process data is valuable because results can be acted upon before large amounts of off-spec product are produced. These techniques can be used to predict product quality problems before they occur by examining multiple process variable inputs and applying a linear regression model or a nonlinear machine learning model.
However, a problem arises because prediction models are typically created from past data. The state of the process is different from the state when the model was taught, causing prediction value shifts. For example, an offset can occur in the prediction model due to degradation of catalyst in a reaction process, changes in the raw material composition and other disturbances.
To address this issue, the prediction value can be corrected by referring to the recent prediction error based on the assumption that the prediction value shifts temporarily. To further improve prediction, based on the assumption that the error of the model is different depending on the operating condition and has reproducibility, data which is close to the operating condition is collected, and the prediction value is corrected based on these prediction errors. Together these techniques can be used to create a just-in-time (JIT) model to improve prediction accuracy.
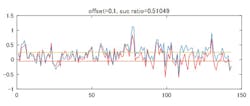
Figure 4 shows the results, with the blue line created before the JIT model is applied, and the red line created after the JIT model is applied. In this case, where the vertical axis is a prediction error and the interval between the two horizontal lines is a desirable prediction range, the deviation is corrected by the JIT model, and the correct answer rate is improved from 46% to 51%. In some catalytic reaction processes, it is necessary to raise the temperature of the reactor as the catalyst degrades to keep the degree of reaction constant. Therefore, when the reaction state is predicted by the temperature, it gradually deviates. In such a case, an adaptive prediction JIT model is effective for controlling the reaction.
Quality versus quantity
There is typically a trade-off between product quality and production quantity, and it is often difficult to increase both at the same time. Product quality can deteriorate due to a number of issues, and it is often difficult to pinpoint the contributing factors. For this type of factor analysis, two methods are generally used jointly.
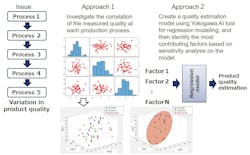
The first is examining the correlation between product quality and process variables one by one, with each process variable and corresponding measured value of product quality mapped on a scatter plot (Figure 5, Approach 1).
Correlation is often not readily apparent on a scatter plot, but detection can be improved when results are shown in different colors according to other conditions such as product brand, production quantity, environment conditions, raw material changes and the like. This is called stratification analysis, and it is a conventional means of correlation analysis.
The lower part of Figure 5 depicts an example where correlation between a good/defective product and an explanatory variable can be seen as a result of excluding the data in a special operation mode (stratification).
The second method is to make a product quality prediction model by inputting multiple process variables as factor candidates, and then analyzing the resulting model (Figure 5, Approach 2). A linear regression model or a nonlinear machine learning model is used to create the prediction model. By analyzing the model, the degree of contribution to product quality problems can be examined for each process variable.
Application example
A process plant in Japan that manufactures specialty polymers was experiencing fluctuations in quality for a particular recipe. In these types of chemical reaction processes, there is often more than one abnormality factor, and the correlation among these factors is often complicated. The impact of disturbances such as temperature and impurities must also be considered. This particular process was difficult to analyze because the reaction progressed by introducing additive agents, while simultaneously raising the temperature.
Batch processes can be analyzed by extracting characteristic process behaviors, hidden in data, that show the progress of chemical reactions, and quantifying these behaviors as feature extractions. To extract a feature, it is necessary to use not only data, but also physical quantities such as calorific values calculated from multiple kinds of data, or to use some kind of conversion calculation such as integration or normalization to help identify previously unnoticed differences in process behavior. This extraction of features is an efficient means for uncovering causes of abnormalities.
Yokogawa's Process Data Analytics tool, for instance, enables the extraction of features, aids in the understanding of the relationship between extracted features and efficiently identifies abnormal factors.
Even if features can be extracted, it is not possible to identify the true cause of an abnormality by just analyzing the relationship between the quality values and the extracted feature. To do this, it is necessary to analyze the data as the reaction progresses. The project team divided the reaction phase into early, middle and latter stages, identified the extracted features for each stage and analyzed the relationship between product quality and the individual extracted features.
Changes in the extracted features at each stage of the reaction impact product quality. Machine learning makes it possible to identify the dominant extracted feature and to verify the certainty of this conclusion. Machine learning is also able to reduce the risks of implementing an action plan for product quality stabilization.
The project team verified the certainty of the extracted features using stepwise regression — a statistical analysis method. Three explanatory variables that contributed to the reaction, including the heating value generated right after the start of reaction, were selected from the extracted features. According to the estimated result, the quality value could be reliably estimated by using these explanatory variables. The project team concluded that the quality value could be correctly manipulated by controlling the three extracted features.
After the factors that had caused fluctuations in product quality were identified, the project team developed new operating procedures, such as adjusting the additive amount depending on the progress of the reaction as indicated by the extracted features. They also designed a display comparing the current extracted features with past lots.
The system enables site operators to carry out their duties while monitoring the progress of a reaction. It is expected that the new operating procedures for controlling the fluctuations in quality with the quality value will reduce costs by several million yen per year.
Conclusion
If the available data set is small, the expected benefits of AI are often not obtained. This issue can be addressed by using accurate process simulations to generate the data required for learning. With these simulations, various combinations of input conditions are used to generate thousands or tens of thousands of cases, and the machine learning model then learns from the generated data.
After this step, the machine learning model can rapidly carry out tasks such as prediction, case study generation and optimization. In addition, when the machine learning model detects a process abnormality, it is possible to use the process simulation to come up with a countermeasure for the abnormality.
At present, extensive human intervention is required to interface with advanced applications, often referred to as human-driven AI (Figure 6).
In the future, data-driven AI will be able to examine data and discover and solve problems. Eventually, knowledge-driven AI will create knowledge by examining one unit or process, and then applying these learnings in other situations.
References
- Otani Tetsuya, "Examples of AI utilization in the manufacturing industry: the form of collaboration between people and machines", Separation Technology, Vol. 50, No. 2, 2020
- Tetsuya Ohtani, "Digital data improvement," Hydrocarbon Engineering, Vol. 25, No. 3, 2020, pp. 69-74
- Adaption of an article from Yokogawa Technical Report Vol. 63 No.1 (2020).”
Dr. Tetsuya Ohtani works in the Advanced Solutions Center at Yokogawa Electric Corporation. He holds a bachelor and a master's degree from Osaka University, and a doctor of engineering degree from Hosei University.


