Modernizing multivariate analytics
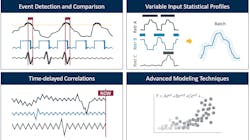
The process optimization challenges faced by process manufacturing companies are rarely one dimensional. To address this and other issues, the field of multivariate analytics evolved to analyze multiple system variables in relation to one another. Multivariate analytics span the full analytics spectrum from descriptive/diagnostic to predictive/prescriptive/prognostic. It is used for event identification and comparison, calculation of statistical monitoring boundaries, process dynamic determination, advanced modeling techniques and other purposes (Figure 1).
Despite the many applications, engineers and data scientists often find it difficult to narrow in on a description or use case for multivariate analytics. Figure 2 demonstrates the breadth of different perceptions present amongst one team in one organization.
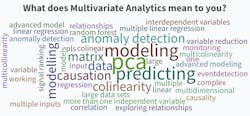
But a few common themes — modeling, predicting, principal component analysis (PCA) and causation — jump out and drive the focus of the use case discussions that follow.
Early barriers to multivariate success
The breadth and complexity of multivariate analytics can be intimidating for process engineers, many of whom have never taken an advanced statistics course. For decades, these engineers have been thrown into a state of spreadsheet peril, navigating resources like MrExcel (the older, less user-friendly sibling of Stack Overflow) to make sense of the multivariate data analysis techniques of their predecessors. These types of spreadsheet tools rely on add-ins for each potential process and contextual data source, requiring multiple time-intensive, down-sampled re-queries anytime a new range of data is explored.
Several more user-friendly statistical analysis packages have entered the market, minimizing the amount of Excel gymnastics required to perform an analysis, but they fall short in terms of data connectivity, operationalization of insights and scaling analytics within an organization.
A live data source connection is critical for any near-real-time or forward-looking analytics. It can also become a factor in model development and deployment since many industrial processes change over time and are not suited to the rigidity of static predictive models. A lack of near-real-time communication between manufacturing systems of record and analytics applications not only keeps the data from flowing upwards to the analytics environment, it also isolates the results from the frontline personnel whose decisions they inform.
New solutions emerge
Advanced analytics applications address these challenges by establishing a live connection to all relevant process and contextual data sources, whether they reside on-premises or in the cloud. Application experiences catering to various process industry user personas can be accessed via browser from anywhere with an internet connection.
Wrapping complex multivariate analytics algorithms into point-and-click tools empowers process subject matter experts (SMEs) to take advantage of advanced regression and machine learning techniques, regardless of their statistics prowess. Built-in mechanisms for creating asset hierarchies enable SMEs to iterate on their use cases, then scale solutions to similar assets throughout the organization. Ad-hoc grouping of assets and signals by SMEs, purpose-built for scaling each use case, rapidly reduce time to return on investment for analytics technologies, without burdening IT resources.
The rate of data science and machine learning algorithm innovation for multivariate analytics has sky-rocketed, making it difficult for software vendors to keep pace. For example, there are over 300,000 modules available from the Python Package Index, just one of many repositories for open-source algorithms. Self-service advanced analytics applications like Seeq have adopted a “bring your own algorithm” approach to multivariate analytics, enabling users to incorporate proprietary, purchased or open-source algorithms into their Seeq analytics. Operationalizing advanced multivariate analytics algorithms into the environment where SMEs thrive enables the scaling of data science efforts without requiring corresponding increases in headcount.
Use cases highlight broad-reaching applications
Manufacturers in all process industries are leveraging multivariate analytics to solve production, quality, reliability and sustainability challenges. When their calculations and algorithms are deployed in near-real-time through advanced analytics applications, they inform operational decision-making capturing value continuously. The use cases detailed in this section highlight solutions that can be applied across a broad range of process manufacturing verticals.
Use case 1: Dissecting golden batch deviations
A large steel manufacturer utilizing the basic oxygen steelmaking process wanted to take advantage of a golden batch approach to optimize the quality of the steel that was being produced during each heat, or batch. They had historically been limited in analytics capabilities by doing statistical profile calculations offline in spreadsheets, without a good way to apply them to in-progress heats. Process SMEs narrowed down the total system variables to a list of five critical process parameters (CPPs) that, in their experience, had the greatest influence on steel quality.
They began with a univariate approach to detecting non-ideal signal behavior. A handful of ideal batches were selected, and for each CPP a three sigma “golden” profile was created and applied to all batches. Monitoring for deviations in these five signals was feasible for a single furnace, but when it came time to scale the analysis to all furnaces at multiple sites, the number of signals being monitored became overwhelming, so a monitoring by exception approach was desired.
The company used multivariate pattern search, an open-source Add-on algorithm for Seeq Workbench, in batch mode to identify heats that were highly dissimilar from the ideal heat, and then quantified the dissimilarity contribution of each of the CPPs for that furnace. The algorithm was configured to run on a periodic schedule for each of the furnaces being monitored. Visualizations like the one shown in Figure 3 were combined into a report where engineers could view heat dissimilarity measurements for all furnaces, quickly identify the cause of the dissimilarity and adjust that CPP before the next heat began.

Use case 2: Detecting sources of oscillation in advanced process control networks
A global specialty chemical manufacturer began seeing instability in the quality of their finished product, which they immediately associated with swings in the flow rates of certain reactants into their reactor system. However, when they took a wider view of the system, they noticed that the oscillations were present throughout the fresh feeds, recycle streams and ancillary equipment surrounding the reactor. The oscillations had begun gradually increasing in magnitude until they were detected visually by the control room operations team.
The highly complex nature of the process made it difficult to parse out cause from effect when engineers were attempting to identify the root cause of the oscillation (Figure 4). It was evident very early on that solving a classic “chicken or the egg” problem like this would require more advanced multivariate statistical analysis than a simple regression.

The company’s data science team used Seeq Data Lab, which can be used for ad hoc Python scripting, to run a Granger causality test on a portion of the data set containing the oscillations. The resulting causal map visualization helped the team to differentiate between highly independent and highly dependent variables, and to locate causal relationships where they existed. This helped the team pinpoint the source of the oscillations, which was found to be a malfunctioning level control valve on a separator downstream of the reactor. Operations transitioned that controller into manual, the system oscillations subsided and product quality results stabilized. Maintenance was scheduled and performed at the next downtime, and the controller was placed back into control with no evidence of sticking.
Use case 3: Optimizing yield in pharmaceutical production
A pharmaceutical company was struggling with low yields in the production of one of their highest-margin active pharmaceutical ingredients. Previous attempts to improve yield had used regression techniques on offline data sets to identify the independent variables most closely tied to yield, and then monitoring for upsets within that subset of variables. The result was a lot of variables being monitored with little insight into what actions needed to be taken when a deviation was detected.
Rather than creating static regression models trapped within offline analysis tools, the company decided to leverage Seeq’s live data source connectivity to build and deploy dynamically updating models. After building a principal component regression model using the point-and-click prediction tool in Seeq Workbench, they thought it might be more valuable to monitor for changes in the models’ principal components, rather than the modeled variable.
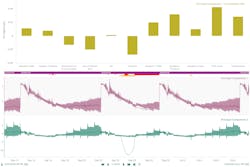
Using Seeq Data Lab, they were able to leverage principal component analysis as a dimension reduction technique, minimizing the number of variables requiring active monitoring (Figure 5, bottom). Just two principal component signals and corresponding variable contribution signals were pushed back to Seeq Workbench, where they were used in other visualization formats, like score and contribution plots (Figure 5, top).
The Seeq Data Lab project updates as new process data is recorded, informing operational decision making to optimize in-progress batch yield.
Use case 4: Improving sustainability with greenhouse gas emissions modeling
A super-major oil and gas company hoped to progress towards sustainability milestones and improve environmental performance using advanced analytics. One of the first focus areas for the team was greenhouse gas emissions mitigation. The site engineering team believed that the variable emissions rates observed over time might be related to operating conditions throughout the upstream, downstream and auxiliary process units.
A centralized data science team worked with site engineers to understand the material flow through the equipment, and to estimate residence times within vessels and transfer times between unit operations. With the sensors shifted to adjust for process lag, they developed an artificial neural network model which estimated NOx emissions based on current state operations at all points in the process.
The algorithm, built by leveraging open-source machine learning libraries in Seeq Data Lab, was operationalized as an Add-on tool in Seeq Workbench. This made the algorithm accessible to site process engineers from a point-and-click user interface, which was used for continuous monitoring.
This near-real-time insight into process emissions empowered site engineers to make proactive process adjustments to reduce overall greenhouse gas emissions and improve site environmental performance. While the model was developed using data from a single refinery, the Add-on tool was deployed in the company’s global Seeq instance, making it immediately available to engineering resources at each of the company’s other refineries. After a brief trial period where a material reduction in NOx emissions was realized at the pilot site, the model was widely adopted as a best practice for monitoring refinery emissions performance.
Conclusion
Multivariate and other complex types of analysis require advanced analytics applications capable of accessing all data sources in near real-time. These applications must incorporate a number of functions to enable self-service access by SMEs, who possess the required expertise to create insights for improving operations.
Allison Buenemann is an industry principal at Seeq Corporation. She has a process engineering background with a BS in Chemical Engineering from Purdue University and an MBA from Louisiana State University. Allison has over six years of experience working for and with chemical manufacturers to solve high value business problems leveraging time series data analytics. In her current role, she enjoys monitoring the rapidly changing trends surrounding digital transformation in the chemical industry and translating them into product requirements for Seeq.
About the Author
Allison Buenemann
Allison Buenemann is an industry principal at Seeq Corporation. She has a process engineering background with a B.S. in chemical engineering from Purdue University and an MBA from Louisiana State University. Buenemann has over five years of experience working for and with chemical manufacturers to solve high value business problems leveraging time series data. As a senior analytics engineer with Seeq, she was a demonstrated customer advocate, leveraging her process engineering experience to aid in new customer acquisition, use case development and enterprise adoption. She enjoys monitoring the rapidly changing trends surrounding digital transformation in the chemical industry and translating them into product requirements for Seeq.