Creating context within process data

Every Industrial Internet of Things (IIoT) application starts with sensors, which create the data needed for advanced analytics. In process plants and facilities, these sensors typically measure pressure, flow, temperature, level and other parameters. Additional process variables of interest are generated by analyzers, power measurement devices, motor drives and other automation system components. Still more sources of data for analysis may include raw material pricing, utility rates, weather conditions, shipping costs, etc.
The sensor data is typically stored in a time series database, usually a process historian. Other relevant data may be found in relational databases, but the primary source of operations/production data in most process plants is a historian.
As its name implies, a relational database, such as the Microsoft SQL Server, is designed for grouping data records so users can easily establish relationships — for example, relating a company to the orders it has open. By contrast, a time series database simply stores all data sequentially with time stamps, with no effort made to establish relationships among the data points.
To address the lack of relationships among data points, users create asset models and hierarchies to define the relationships, showing how sensor data relates to assets, lines, plants, etc., but there is still an issue "within" sensor data streams, which is a lack of context. In other words, context requires defining specific time ranges within sensor data and relating these time ranges to asset stages, production modes, products and so forth.
Because no context or relationships have been established among data points in a time series database, the person performing the advanced analytics must execute this task. This article shows how this can be done with results and benefits gained when using advanced analytics software to define context and accelerate insights. But first, it discusses why time series databases are favored in the process industries instead of relational databases, which would have at least some context predefined.
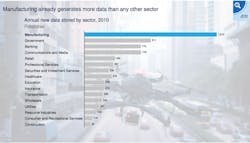
Figure 1. The volume of data generated in process and other manufacturing plants precludes the use of relational databases for storage. Graphic courtesy of McKinsey Global Institute
The biggest data
The term big data is bandied about in many different industries nowadays, but no industry creates and stores more data than manufacturing. Figure 1 shows manufacturing generates twice as much data as the next sector — government — and dwarfs all other sectors.
To see why this is so, consider a typical large process plant, like a refinery. The historian for such a facility could easily have 120,000 separate points of data, each sampled once per second. Over the course of a year, this would amount to billions of data points. This volume of data would simply overwhelm a relational database, whereas time series databases can store this volume of data and much more.
Another issue leading to the use of time series databases in process plants is the need to predefine relationships in a relational database. While this may be relatively simple for some types of data, it would be devilishly difficult for a process plant, which is why so few end users have implemented asset models or hierarchies to define these relationships.
First, all the sensors (data points are within a sensor signal) would have to be grouped into subsets, perhaps by unit. Adding sensors later on, a frequent occurrence in a process plant, would be very expensive due to the nature of asset models and the difficulty of updating them. Even if this first step could be done with a high degree of accuracy, with no changes ever needed later on, the next step could not.
The second step is establishing relationships among the data points. For example, if a flow increases at one point, exactly how many other process variables would be affected, and how? The exact nature of these types of relationships are never known until a plant is up and running, and in fact developing and analyzing these relationships, or adding context, is one of the most important steps for creating insights to data.
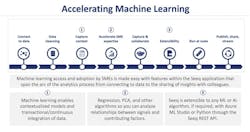
Figure 2. Creating and sharing insights into process data requires completion of these steps in a sequential fashion. Following graphics courtesy of Seeq
Steps to insight
As shown in Figure 2, advanced analytics requires users to follow a series of steps. The myth of machine learning is its ability to produce insights automatically by simply turning the right software loose on a database, with answers to any and all questions created instantly.
The reality is very different, as data connections must first be established, as shown in Figure 3, which depicts an advanced analytics architecture for a typical process plant. As previously mentioned, process data is typically stored in a process historian using a time series database. SQL data sources are relational databases, and a software development kit (SDK) within an advanced analytic software platform can be used to connect to other data sources, both time series and relational.
Connectors to all of these data sources provide an advanced analytics application, such as Seeq, with the required raw data. A subject matter expert (SME) must then perform data cleansing on this raw data, and then create context to define the time periods of interest — for example, a time range within a signal to be investigated, which would typically require reference to a definition in another system (batch ID, batch start time, ingredient supplier, etc.).
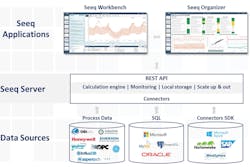
Figure 3. Advanced analytics software pulls data from many different sources, including time series and relational databases.
Once these two steps are performed, the SME can then accelerate his or her expertise to create insights, either alone or in collaboration with others. These results can then be disseminated to others within the organization. The best way to perform these steps is by putting the right advanced analytics software in the hands of an SME in the form of a simple to use yet powerful tool.
Figure 4 shows just how an SME might use such a tool to capture context. In Seeq parlance, for example, a capsule is created to define conditions when a particular state of interest exists. A capsule can be defined by time, limit, pattern and/or other conditions. Once a capsule is created, the data within it can be viewed, combined and manipulated by an SME to create insights.
The following example shows how advanced analytics can be used to improve process plant operations.
Reducing reheater fouling in a steam turbine
Steam turbines are used in coal-fired, nuclear and other types of thermal power plants. A boiler heats water to turn it into steam, and the steam is fed to the one or more turbines. The turbine is connected to a generator, which spins to produce electricity.
There are two turbines at this facility. The boiler feeds high-pressure steam to spin the first turbine, and low-pressure steam exits the turbine. This low-pressure steam is routed through the reheater section of the boiler, improving the quality of the steam and increasing its temperature. From the reheater, the steam is fed to the low-pressure turbine, and exit steam from this turbine goes to the condenser and is pumped back to the boiler as a liquid.
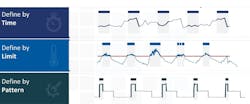
Figure 4. Adding content to data requires definition of areas of interest according to time, limits, patterns and/or other factors.
Using two turbines and a reheater improves the overall heat rate, which is the most commonly used measure of system efficiency in a steam power plant, and is typically calculated in British thermal units/kilowatt-hours (Btu/kWh). Even a very small improvement in heat rate can result in very significant bottom-line impacts, and one of the ways to improve heat rate is by improving reheater performance.
Like most heat exchangers, reheaters are subject to fouling, whereby undesired material is deposited on heat transfer surfaces, degrading thermal and mechanical performance. Fouling is a dynamic phenomenon that changes with time. Fouling increases the overall thermal resistance and lowers the heat transfer coefficient of heat exchangers. Fouling also impedes fluid flow, accelerates corrosion and increases pressure drop across heat exchangers.
A power plant needed to optimize maintenance of its reheater and needed to know whether it was best to shut down a unit right away to clean the reheater or wait until the next scheduled shutdown. The plant needed to create a fouling model based on operating conditions, but the data was very noisy, making it extremely difficult to measure the degree of fouling. The plant’s reheater expert used Seeq advanced analytics software to create the model and determine the optimum time for maintenance.
The first step was to define the time periods for analysis by adding context using the software’s data search tool, and to then set certain variables such as ambient conditions and enthalpy flow in steam at constant values. As shown in Figure 5, context was created by comparing three key variables derived from the data and displaying each on a graph: the ratio of exit gas temperature to the reheater damper position (green trace), the reheat steam enthalpy flow (purple trace), and exit gas temperature energy (orange trace).
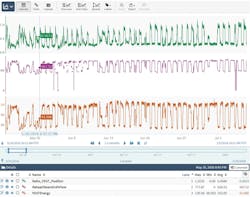
Figure 5. A screenshot of reheater use case. Seeq advanced analytics software allows process engineers to create context among different variable to accelerate insights.
The reheater expert knew it would be best to build the fouling model based on a constant enthalpy flow, specifically about 80 percent of capacity. Fixing this dimension removed much of the complexity for generating the fouling model. This would have been a very cumbersome and time-consuming process using a conventional tool such a spreadsheet because the process of defining the context would have been done by hand. But in this case, the plant’s reheater expert used his understanding of the process to reduce dimensionality in about an hour, with no assistance required from a data scientist or from IT personnel.
Using this model, the plant is now able to optimize future shutdowns, evaluate antifouling measures, assess the impact of different modes of operation and calculate the cost of fouling on a continuous basis.
Conclusion
Most process plants have more than enough data, primarily stored in time series and relational databases. Time series databases typically house most of the process data in historians, but this data is stored without creating any context.
Advanced analytics software is designed to help SMEs create context from the data stored in time series databases. The software empowers an SME to interact directly with the data of interest, without requiring assistance from a data scientist or from IT personnel. This accelerates insights and produces operational improvements.

Michael Risse is a vice president at Seeq Corporation, a company building innovative productivity applications for engineers and analysts that accelerate insights into industrial process data. He was formerly a consultant with big data platform and application companies, and prior to that worked with Microsoft for 20 years. Risse is a graduate of the University of Wisconsin at Madison. He lives in Seattle.