What if you could see the future from your plant floor? Or from a computer in your office?
A new software solution is helping brewery operators look into the future to optimize their bottling or canning lines. The technology comes in a self-contained unit that connects in one day to an existing line and shows data that was not accessible before. Armed with this information, breweries are able to increase line capacity through more efficient use of production line assets. Understanding why lines are underperforming is a key first step to accomplishing this, and the new brewery line optimization software makes this possible.
Brewers are often surprised to learn how much their lines are underperforming. Lines never seem to produce the throughput they should be capable of, and operators and production managers frequently don’t have the information they need to figure out why. This leads to expensive production losses, and for rapidly growing operations, it can lead to unnecessary or premature capital expenses. With today’s technology, many of these losses can be avoided, and the answer lies in collecting and analyzing the right data. This type of software is showing breweries how to do that.
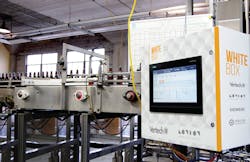
Created by Vertech, a U.S.-based control systems integration firm, and London Consulting Group based in Mexico, the White Box software runs on Ignition by Inductive Automation – an industrial application platform for human machine interface (HMI) and supervisory control and data acquisition (SCADA). Several craft breweries have implemented the technology to gain insights into their production lines.
“We work with a lot of craft breweries, so we understand how to help them operate more efficiently,” said Chris McLaughlin, SCADA and MES specialist with Vertech. “We partnered with London Consulting Group and Inductive Automation to create a plug-and-play enclosure, with a high-definition touch screen on the front. It connects to any brewery’s bottling or canning line in one day. After that, it’s immediately gathering real-time data using the brewery’s actual product codes, line rates and downtime reason codes.”
The system pulls real-time information from existing plant equipment like fillers, labelers and packaging equipment by connecting directly to their controllers. This connection permits the collection of real-time performance information and automatic sensing of downtime reasons. When connections to existing equipment are impractical or not possible, direct connections are made to key sensors for production volume and product counts.
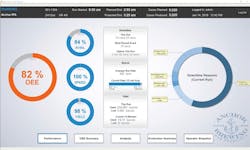
Using data collected from the various production line components, the device provides detailed insight into line performance. Overall Equipment Effectiveness (OEE) is determined in real time during production runs, which shows whether efficiency losses are caused by line availability, line speed or quality issues like short-fills, mislabels or other factors. The software also keeps track of downtime reasons, so if efficiency is degrading because of availability, operations personnel know exactly what prevented the line from running in order of greatest impact.
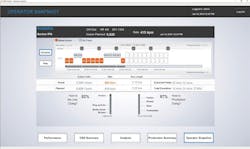
The touch screen interface is located on the production floor. This interface allows the operator to provide information that cannot be automatically collected like non-technical downtime events, for example. The interface also provides operators with an intuitive interface showing them how well production is running against established targets as each shift progresses.
Most importantly, time and yield calculations can be displayed in terms of real dollars on the screen. Using cost and pricing information provided by the brewery, the device will display accumulated losses in the units that matter most, dollars.
By connecting to the local plant network, the system gives production managers secure access to plant data from desktop computers and laptops and provides real-time performance data, such as actual output compared to planned.
“We typically leave the unit in place for two or three weeks,” said McLaughlin. “That allows us to gather enough information to show people the possibilities for improvement and how they can become more efficient. Dashboards can show you the data on all your products individually, or all of them grouped together. And you can see losses by availability, speed and yield. We utilize these numbers to present the opportunity for a 12-month ROI on an entire project.”
Anchor Brewing case study
The technology has been installed in several breweries, with the first at Anchor Brewing in San Francisco. Founded in 1896, Anchor produces more than 150,000 barrels of beer annually. The brewery has been making its signature Anchor Steam Beer for 120 years.
“Prior to the product installation, we knew what our run rate was, based on the index speed of the filler, but we didn’t have a lot of insight into how the line actually operated over time,” said John Castle, process engineer with Anchor Brewing. “We had a set point of 415 bottles per minute, but we didn’t really know how often we were down, or what our actual run speed was, based on other elements in the line. This was very easy to integrate into our line. And we were able to see that our actual run rate, on average, was far lower than what we’d expected. It gave us some insight into where we needed to focus our efforts to improve our line efficiency.”
Sean O’Neill, packaging manager with Anchor, agreed that the data was very useful. “This was our first foray into real-time data analysis on our packaging lines,” O’Neill said. “And it was really helpful. Having that kind of data at our fingertips really helped us figure out where the problems were, and where we could make improvements. It allowed us to have a much better idea of how the line worked.”
The unit was built to be intuitive and non-obtrusive on the line. And simplicity was one of the key goals, said Vertech’s McLaughlin. “There were three self-imposed objectives,” he said. “First, we wanted it to be installed, connected and gathering data in only one day. We also wanted it to be built like a Swiss Army Knife, so it could connect to any programmable logic controller, any line configuration, any network and any power source. And finally, we wanted everyone in the whole facility to have access to the data.”
Anchor Brewing is planning to do more with the software in the future. “Seeing the software running on our bottling line got us excited to use it on our other packaging lines in the brewery, including racking and canning,” said Castle.
A clear vision
Eric Sahakian, a control systems engineer with Vertech, created the screens for the unit with simplicity in mind. The operator’s start screen was designed with only three buttons. “Then we have buttons for the various products we might want,” Sahakian said. “There are different case configurations, all built into each button, so the operator doesn’t need to think about it. They select the product, how many cases to make, and then press ‘go.’ That’s it. The line will start, and we’ll see data showing up on the screens.” Information on what is running, the schedule, the rate and the projected end time based on the current run rates is displayed. “We can also see outputs – how much we’re supposed to do, how much we’ve done so far, and how much we have left to do,” Sahakian said. “All of this is on just one screen. We can also see on that screen the OEE metrics, such as the uptime and the rate.”
While this software does not predict the future, it does show breweries how much brighter their futures could be. It’s just a matter of a single connection to a single box – and using the results to create more efficient production lines.
3 things breweries can do to improve production lines
1. Streamline production scheduling. The most significant improvements in line efficiency are made through streamlining production scheduling to minimize product and production time losses caused by changeover.
2. Challenge operational assumptions with data. The obvious is not always obvious. Challenging operational assumptions with data leads to hidden improvements.
3. Measure repeatedly. Improvement does not have to be expensive. Repeated measurement will reveal your best production run. Significant efficiency gains can be achieved by working to bring every run up to this level.
Jim Meyers is success manager at Inductive Automation, which creates industrial software that empowers organizations to turn great ideas into reality by removing technological and economic obstacles. Titus Crabb is president of Vertech, a control systems integration firm providing expertly engineered automation solutions for industrial clients. Both companies are members of the Control System Integrators Association (CSIA).