Bulk solids segregation: How to improve powder mixture uniformity
Key Highlights
- Particle size, shape, friction, aerodynamic behavior and fluidization can all contribute to bulk mixture segregation.
- Bench-scale reflectance measurements can quantify ingredient concentrations at multiple points across a material pile.
- Adjusting filling location, hopper inserts and discharge velocity profiles can reduce segregation during vessel emptying.
Companies producing powder mixtures for industries such as food, agro-industrial, nutraceuticals, chemicals, beverages, pharmaceuticals and cosmetics generate approximately $444 billion in annual sales. However, poor product quality and related downtime result in an estimated $89 billion in annual losses, including $31 billion from quality issues and $58 billion from production downtime. Mixture segregation contributes significantly to these losses by preventing consistent product composition and accurate packaging. This article explores how manufacturers can address bulk mixture segregation to improve product quality and reduce production losses.
What causes bulk solids segregation?
Segregation has many causes. Fines may sift down through a matrix of coarser particles, resulting in segregation based on differences in particle size. Particles may have different surface characteristics, some round and smooth and others sharp and angular. As such particles flow down a pile, the reduced friction of the rounder particles causes them to travel more quickly than the angular/sharp particles, resulting in segregation.
Some particles are sufficiently light or small enough to be carried by air currents. Air is entrained in a free-falling stream of bulk material. When this falling stream contacts any stationary surface it liberates the entrained air, carrying finer, lighter particles down the pile and leaving heavier, larger particles at the top of the pile. Thus, segregation can occur due to the aerodynamic properties of two or more materials. In fact, any difference between two or more particles can induce segregation in process vessels.
Other particle scale properties that induce segregation include differences in: bounciness of the particles, static charge of particles, magnetic properties of particles, differences between wall friction angles, or the ability to fluidize two or more different materials. Each segregation mechanism results in a distinct segregation pattern as a process vessel fills. Each pattern can have a distinct magnitude in terms of how it segregates the material. It is possible for these segregation mechanisms to happen simultaneously.
Obviously, there is a lot going on that describes general segregation of a bulk material. However, often just understanding the pattern and magnitude of the segregation pattern can lead to a solution even if you do not know the cause of the problem.
To solve a segregation problem, you must answer two questions: First, how are the segregation magnitude and pattern measured for the mixed material and what specifically is required to quantify the product segregation in the handling and packing system? Second, assuming that the segregation pattern information is known, what can be changed about the process to reverse that segregation effect?
How vessel filling affects powder segregation
Every process vessel is filled and then fully or partially emptied. Material typically enters an inlet and forms a pile in the center of the vessel or anywhere that does not currently have some other process equipment in the way. It stands to reason that understanding the segregation pattern and magnitude as piles are formed in process equipment is an important part of solving a segregation problem. Sometimes, flow aids or the way material is transferred from one vessel to another induce conditions that increase segregation.
Consider a case where fine material is transferred into an empty vessel that is not vented during the transfer. The material flowing into the upper part of the vessel must displace the gas in the lower part of the vessel. There is nowhere for the displaced gas to go but upward through the bulk material. This filling process results in periodic burps of gas bubbles rising through the material. If the material is prone to segregate by fluidization effects, this filling action may induce a layered segregation pattern with the fines above the coarser material.
It is important to understand the segregation pattern with sufficient detail to predict how the material will discharge from the vessel. This often requires knowing segregation patterns at 20 to 50 points across the pile or down the depth of the material after a fluidization event. Characterizing how the individual components in the mixture segregate is critical to understanding process segregation.
Match discharge velocity to the segregation pattern
One way to measure segregation is to form a pile in bench-scale equipment and then measure the reflectance spectra of the material mixture along the pile. If these reflectance spectra along the pile are all the same, then segregation is not important. If reflectance spectra along the pile are different, then segregation is important.
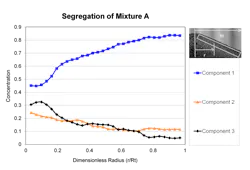
Measuring the reflectance spectra of each ingredient along with the spectra of the mixture along the pile allows you to calculate the concentration of each key component at any point along a pile (Figure 1). A dimensionless radius of 0.0 is the top of the pile and a dimensionless radius of 1.0 is the bottom of the pile. For the mixture in Figure 1, note that component 1 accumulates near the bottom of the pile, while components 2 and 3 accumulate near the top of the pile.
Let’s focus on component 2. The concentration of component 2 ranges from 24% at the top of the pile to 11% at the bottom of the pile. The basic principle of solving a segregation problem is to match the velocity profile that develops in the process vessel to the segregation pattern imposed during filling. We can take this measured segregation pattern for component 2 and superimpose that in a bin containing mixture A.
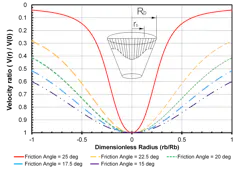
If the bin inlet is at the center of the bin then the top of the pile is also at the center. This induces a high concentration of component 2 in mixture A at or near the center of the bin during filling. Conversely, the material near the edge of the bin should have a low concentration of component 2 after filling. Flow properties (wall friction angle) can also be used to compute the velocity of material in the bin during discharge (Figure 2). The velocity in the bin during discharge is combined with the segregation pattern to determine the concentration of component 2 that leaves the bin during discharge.
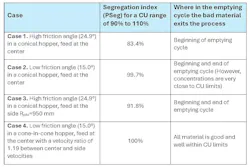
Let’s consider four situations. First, filling the bin at the bin center where the friction angle of the material against the conical walls is high (24.9°) (Figure 3). Second, filling the bin at the center where the friction angle of the material against the conical walls is low (15.0°) (Figure 4). Third, filling the bin near the side of the bin where the friction angle of the material against the conical walls is high (24.9°) (Figure 5). Fourth, filling the bin at the center with inserts placed in the hopper section to modify the velocity profile during discharge (Figure 6).
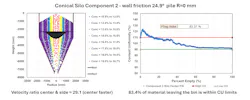
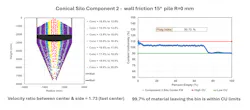
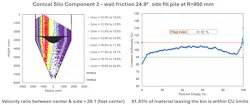
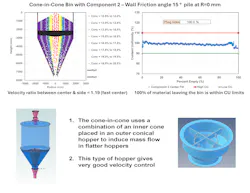
Note that, in the case of the cone-in-cone hopper, the hopper can be designed to adjust the relative flow rates that pass through the center hopper and the flow rate passing through the annular section of the cone-in-cone. In all cases the velocity profile in each bin is shown (black velocity profile). The expected content uniformity of material leaving the bin during emptying is also shown. This shows the effect of velocity on the segregation of component 2 in the output stream for each case.
Evaluate mixture quality with a segregation index
We expressed the concentration leaving the bin in terms of content uniformity of component 2 during discharge and assumed the bin was filled completely and then discharged completely (a worst-case scenario). At this point it is critical to determine what content uniformity is acceptable with this product. Typically, pharmaceutical and high-end nutraceutical manufacturers require the final product content uniformity to be between 95% and 105%. The gold standard for food is a content uniformity between 90% and 110%. Some foods can be considered good with content uniformity values between 85% and 115%. But the absolute FDA limit is +20%.
Reduce segregation through process and hopper design
The take-home message is that by matching the velocity profile to the segregation pattern, segregation in process vessels can be eliminated. In some cases, segregation can be reduced by moving the charge location. In some cases, inserts are required to optimize segregation of mixtures. This technique provides a reliable scientific method that can be used to determine if a segregation problem exists in the process vessel. The technique requires measuring the segregation pattern and magnitude on bench-scale equipment as well as measuring some flow property information (such as friction angle). This bench-scale data allows for the calculation of velocity profiles that, when combined with segregation patterns, results in a robust method that predicts the content uniformity of the mixture as it leaves the process during discharge. This serves as a valuable tool to prevent segregation in process vessels.
About the Author
 Kerry Johanson
Dr. Kerry Johanson is chief operations officer at Material Flow Solutions. He began his career in powder flow and material handling as a summer lab technician with Jenike & Johanson in Billerica, Massachusetts, during his high school and undergraduate years. After receiving his BS in 1985, he spent 14 years with JR Johanson, Inc. in San Luis Obispo, California, finally serving as Chief Technical Officer. Dr. Johanson received his Ph.D. in chemical engineering from Brigham Young University in 1994, and in 2000, he branched out and moved to Florida where he divides his time researching at the University of Florida Particle Engineering Research Center and serving as the Chief Operations Officer for Material Flow Solutions, Inc., the consulting firm he founded in 2001.
Dr. Johanson has authored 50+ technical papers which have been published in numerous technical journals internationally. He has developed a course for teaching powder flow and technology to graduate students and mentored five doctoral graduates at the University of Florida. He has presented numerous industry seminars on the topic of powder flow in industrial applications. Dr. Johanson holds PE licenses in both Florida and Utah and is an active member of AAPS, ACC&CE, AIChE, ASME, and ASTM.
Related
 Powder flowing into pile
