US chemical production marks fifth month of growth in November

WASHINGTON, Dec. 22, 2020 (PRNewswire) — The U.S. Chemical Production Regional Index (U.S. CPRI) rose 0.4% in November following a 1.1% gain in October and a 0.6% gain in September, according to the American Chemistry Council (ACC). During November, chemical output expanded in all regions, with the largest gains occurring in the Gulf Coast and Midwest regions. The U.S. CPRI is measured on a three-month moving average (3MMA) basis.
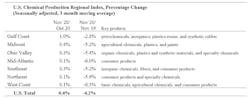
In November, chemical production continued to improve in many segments, including fertilizers, synthetic dyes and pigments, chlor-alkali, other inorganic chemicals, and organic chemicals. Production trends eased in coatings, manufactured fibers, consumer products, adhesives, synthetic rubber and crop protection chemicals.
As nearly all manufactured goods are produced using chemistry in some form, manufacturing activity is an important indicator for chemical demand. The manufacturing recovery continued for a fifth straight month in November, with overall factory activity up 0.7% (3MMA). The trend in production rose in nearly all key chemistry end-use industries, with the strongest gains seen in iron and steel, aerospace, rubber products, paper, structural panels, and printing.
Compared with November 2019, U.S. chemical production was off 4.2% on a year-over-year basis, the eighteenth consecutive month of Y/Y declines, but shows continued improvement over the past several months. Chemical production remained lower than a year ago in all regions, with the largest year-ago declines occurring in the Northeast, Mid-Atlantic, and West Coast regions.
The chemistry industry is one of the largest industries in the United States, a $565 billion enterprise. The manufacturing sector is the largest consumer of chemical products, and 96% of manufactured goods are directly touched by chemistry. The U.S. CPRI was developed to track chemical production activity in seven regions of the United States. The U.S. CPRI is based on information from the Federal Reserve, and includes monthly revisions as published by the Federal Reserve. To smooth month-to-month fluctuations, the U.S. CPRI is measured using a three-month moving average. The reading in November reflects production activity during September, October and November.