Pharma sustainability starts by leveraging operational data

Sustainability is a complex and multifaceted topic for pharmaceutical manufacturers. Not only must they combat the adverse effects of a high carbon footprint and other environmental issues, they also must balance their environmental stewardship with a commitment to producing safe and quality products for better health.
The concept of sustainability has come to be measured by the environmental, social and corporate governance (ESG) framework. According to research from Deloitte, pharma companies face challenges in all three pillars of the framework. Yet, they can be successful in their quest to reduce carbon emissions, energy consumption and water use.
To meet the demands, the pharmaceutical industry will need to become more agile in its manufacturing practices. This includes adding flexibility in the scaling of production and performing predictive maintenance on targeted assets. Comprehensive water and energy management programs also will need to emphasize recycling, reusing and reducing resources throughout the plant. Finally, pharmaceutical companies need to monitor for deviations in parameters that could lead to a failed batch. To coincide with batch quality improvements, companies also should have a waste minimalization plan.
Inside operational data
One of the ways that leading pharmaceutical companies have met these goals is by analyzing time-series data. This sensor-generated information can provide insights about process behavior over time. It also can uncover clues that engineers can use to optimize performance. In turn, these enhancements can help companies reduce operating costs while improving overall product quality.
For example, engineers can determine the root cause of anomalies in process behavior as well as find other details on how to make a variety of operational improvements. They also can use this information to schedule timely maintenance to prevent fouling of certain equipment, such as heat exchangers or biological aeration elements for water treatment.
Once engineers have determined the best operating conditions, they can create a golden fingerprint that includes the ideal parameters for the process to function optimally. They then can monitor for changes to the golden fingerprint and send timely alerts that notify key personnel that they need to adjust the process before it leads to a failed production run. And while engineers can use industrial analytics to solve 80% of these challenges themselves, they also can collaborate with a data scientist to solve the most complicated cases with a machine learning exercise.
The following are examples of how operational data can improve pharmaceutical sustainability.
Performing prescriptive maintenance
Heat exchangers that cool or heat raw or intermediate material can foul quickly when they are used for different grades of products. The controlled cooling phase is the most time-consuming of the subsequent heating and cooling phases. It becomes almost impossible to monitor fouling when the heat exchanger is used for different product grades and when a different recipe is required for each.
Fouling of heat exchangers increases cooling time, but its scheduling requires consideration. When the maintenance on a heat exchanger is performed too early, the process is taken offline unnecessarily and the result is unwarranted downtime. On the other hand, failing to clean the reactor on time leads to degraded performance, increased energy consumption and safety risks.
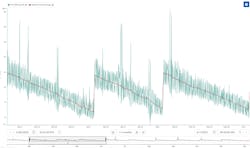
At one pharmaceutical plant, engineers set up a monitor that looked at the cooling times of the heat exchangers when they were running a batch of their most highly produced product, as shown in Figure 1. When the duration of the cooling cycles grows longer, engineers know it is time to schedule maintenance. They can get this warning as early as two to three weeks before the cleaning becomes critical. In the end, the benefits of predictive maintenance on heat exchangers are extended asset availability, cost reduction and improved safety risks.
Monitoring for temperature changes
In the sterilization process of a filling unit, the unit needs to heat up to 90°C and maintain that temperature to initiate cleaning. When the cycle time of this process step takes too long, it means that the unit did not heat to the correct temperature and the vessels in the unit have not been cleaned correctly.
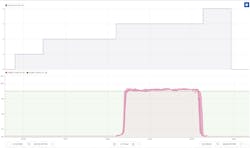
Engineers at one pharmaceutical company noticed that their clean-in-place (CIP) unit was not reaching the desired temperature. They explored their operational data to determine how often this was occurring so that they could create a more predictable process. First, engineers compared different sterilization in place cycles. As shown in Figure 2, they were able to see that for certain batches, the cycle was not able to maintain a 90°C temperature during the phase where the caustic flow is fed into the vessels.
Next, engineers used this information to set up a monitor and alert system that notified personnel when the phase is taking too long. They will know that the correct temperature is not being reached, and they will be able to adjust the temperature before a failed CIP cycle. As a result, engineers were able to take proactive instead of reactive measures to ensure the CIP performed as expected.
Eliminating vaccine quality concerns
During the COVID-19 pandemic, engineers noticed a problem with batch quality of the newly developed vaccine. Because producing a safe vaccine quickly was critical, they used operational data to search for clues that would explain the failed batches.
First, the engineers saw from trends on their production dashboard that the cycle time of a recent batch was much longer than normal. A box-plot tile revealed that some of the process phases had a higher variation than others. Although the process appeared to be operating OK at the time of the investigation, contextual information showed “failed batch” events throughout production.
Knowing that pH is a major driving factor in final vaccine quality, engineers started with this parameter. They saw that a drop in temperature seemed to be causing a drop in pH. They therefore hypothesized that this was likely the root cause of the failed batches.
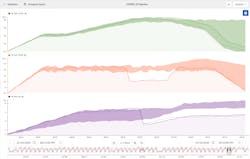
Finally, they compared a failed batch with previously known good batches (that had been saved for a golden fingerprint) as shown in Figure 3. They quickly saw that first the temperature dropped out of range, which was then followed by a drop in the pH out of range. This supported their theory.
Engineers created a monitor an alert system that notified personnel with the temperature or pH fell out of range. This gave them enough time to change the temperature before a failed batch could occur.
Conclusion
Analyzing operational data helps pharmaceutical engineers make educated decisions their manufacturing processes. By looking at data over time, they can solve a variety of operational improvements, increase the bottom line and achieve sustainability goals through waste, water and energy reduction measures.
By using advanced industrial analytics to make data-driven decisions, the pharmaceutical industry will be well-positioned to meet sustainability challenges now and in the future.
Vincent Teran is a data analytics engineer with the Customer Success team at TrendMiner. He has a background in manufacturing and enjoys helping process engineers find interesting insights in their operational data. Prior to working at TrendMiner, Vincent was an engineer for Goodyear Tire & Rubber Company.
TrendMiner