The industrial AI gap isn't capability — it's deployability
Key Highlights
- Most plants already possess extensive digital tools but face challenges in translating data into actionable insights at scale.
- Deployment architecture—whether data-first, sensor-first, or transformation-first—determines the success of scaling AI and sensing solutions.
- Starting with one critical problem, using existing data, and adding minimal sensing helps manage complexity and proves value early.
- Optical sensing methods like UV/Vis and NIR can reveal hidden process states, improving observability in food, beverage, wastewater, and cooling systems.
- Timely visibility is crucial; continuous sensing reduces decision delays caused by traditional grab samples and lab tests, minimizing costly downtime.

Process manufacturers do not have a shortage of digital capability. Historians, PLCs, SCADA systems, laboratory databases, condition-monitoring tools and increasingly capable analytics are already common. Yet a plant can know pressure, flow, tank level, valve position and motor state continuously while still discovering an expensive physical condition too late.
That distinction helps explain an apparent contradiction in industrial digitalization. McKinsey reported that 72% of process-industry respondents said their digital transformation had stalled before achieving at-scale impact. Deloitte's 2025 survey of 600 manufacturing executives found only 29% using AI or machine learning at the facility or network level, while another 23% were still piloting it. Almost two-thirds, 65%, ranked operational risk as a first- or second-priority concern when implementing smart-manufacturing initiatives. [1,2]
At the same time, focused sensing projects can create large operating gains. In one 2026 beverage application reported by Processing, more than 160 CIP cycles were evaluated over six weeks. The plant identified average water savings of 1,586 liters per cycle, approximately 4 million liters per year, while shortening CIP by about 10%. A separate Processing article described an average 25% reduction in process-cycle time from real-time spectral sensing and AI, with individual supplier-reported operating opportunities ranging from about $100,000 to $2 million. [3,4]
The conclusion is not that industrial AI lacks value. The harder problem is deployability: reproducing value without turning every use case into another integration program, hardware project and specialist workflow.
Deployment architecture determines whether a good use case can scale
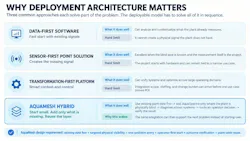
Three common deployment patterns each solve part of the problem. Data-first software can move quickly against historian, SCADA, laboratory and sensor data. Its hard limit is observability: software cannot reliably create a physical state that the plant never measured. Sensor-first point solutions can create that missing signal, but every new use case can become another hardware, calibration and interface project. Transformation-first platforms can unify large operating domains, but broad integration scope, staffing and change management may arrive before the first use case proves its economics.
A brownfield plant usually needs a narrower sequence. Start with one expensive problem. Use the data already there. Determine which physical state remains invisible. Add the minimum sensing required to expose it. Diagnose the condition in the context of the rest of the plant. Keep the operator and established controls authoritative. Verify whether the intervention changed the outcome. Then reuse the same integration for the next problem.
This sequence matters because it keeps the first deployment smaller than the problem while preserving a path to plant-wide reuse. It also prevents a common failure mode: buying more data before defining which decision the new data is supposed to improve.
The first hard limit is observability
Consider product loss in a food or beverage process. A flowmeter can show liquid moving. A PLC can show a valve opening. A tank-level signal can show inventory changing. A historian can preserve all three. A laboratory can later characterize a sample. None of those necessarily answers the immediate economic question: what material is moving through this line right now?
If that state is not measured, another analytics layer cannot manufacture the missing physics. The plant needs an additional perception modality. For liquid processes, UV/Vis spectroscopy can expose changes in optical and organic signatures, product transitions and abnormal states. When the missing state is more compositional, near-infrared sensing can add sensitivity to O-H, C-H and N-H combinations associated with water, carbohydrates, proteins and lipids. Quantitative outputs still depend on representative reference samples, matrix conditions and validated models; NIR is not a universal direct-reading chemistry sensor. [5,16]
Two food and beverage examples are enough to show the principle. In starch processing, a calibrated spectral model can distinguish product-rich washout from normal rinse water, making carryover and washout a continuously observable state. In dairy, NIR literature supports models for fat, protein and lactose, which maps to milk-to-water transitions, residual product during CIP, cream or whey carryover and composition drift. [5,6]
The more important lesson is architectural: the sensor should follow the blind spot. If existing data already exposes the first problem, new hardware is unnecessary. If the plant is physically blind, targeted sensing should enter the same context and decision layer rather than becoming a separate island.
Wastewater and data centers expose the same gap in different ways
Industrial wastewater offers a larger set of direct examples. Conventional instrumentation may continuously expose flow, pH, dissolved oxygen, conductivity and tank level while leaving the operator without a continuous view of organic loading, suspended solids, nitrate or the signature of an abnormal influent event. Published work has demonstrated in-situ UV/Vis and NIR models for COD, nitrate and TSS in activated sludge, including detection of induced process disturbances. A 2025 Water Research study separately demonstrated real-time online COD monitoring in an industrial wastewater process using NIR. [7,8]
Continuous optical information can also become part of treatment optimization rather than merely monitoring. A 2024 study of tertiary ozonation used real-time UV/Vis measurements to adjust ozone dosing; the model reported 94.29% dosing-prediction accuracy while measured COD removal varied from 16% to 71%. The point is not that one calibration transfers everywhere. It is that a physical state that once arrived through periodic testing can, with the right validation, become part of an operating loop. [9]
Data-center liquid cooling presents the same observability problem in a different physical system. Temperature, pressure and flow describe heat transport, but they do not fully describe coolant chemistry. Current liquid-cooling guidance identifies pH, conductivity, contamination and water-glycol composition as important to corrosion, fouling, heat-transfer performance and reliability. NIR is relevant where composition itself is ambiguous: a 2025 study using a miniaturized NIR analyzer reported a 0.026% detection limit for trace water in ethylene glycol. In a cooling loop, the useful operating state is not 'spectrum changed.' It is closer to 'coolant mixture is drifting after top-up' or 'unexpected water ingress is developing,' correlated with CDU flow, temperature, pressure and workload context. [10,11]
These applications look different, but they share the same design requirement: use existing instrumentation for context and add a new modality only when the plant lacks the physical signal needed for the decision.
The second blind spot is time
A plant can also have the correct measurement and still lack timely visibility. Grab samples and laboratory testing remain essential for compliance, calibration and ground truth, but they observe a dynamic process at discrete points in time. The standard EPA BOD method, for example, uses a five-day incubation. That result can be critical for validation and reporting; it cannot function as a real-time operating signal. [12]
The cost appears in the decision window between the physical change and the confirmed result. In CIP, end-of-cycle swabs or grab samples can leave plants choosing between chronic overwashing and the downtime of repeating a cleaning step after a failed result. In the 2026 beverage case cited above, continuous liquid analysis detected transitions that the existing conductivity measurement did not resolve. ABB's survey of 3,215 industrial organizations reported median unplanned-downtime costs of approximately $84,681 per hour in food and beverage and $98,222 per hour in water/wastewater. Those are sector-wide downtime figures, not costs caused by laboratory testing, but they illustrate why unnecessary hours of uncertainty matter. [3,13]
The practical architecture is therefore not 'sensor versus lab.' The laboratory should remain the reference layer. Continuous sensing closes the blind interval. Existing plant signals provide context. Analytics determine whether the change matters now.
Context and verification turn a signal into operating value
A spectral change is not automatically an anomaly. During a product transition, it may be expected. During CIP, it may mark the endpoint operators are waiting for. During stable production, the same change may indicate a developing problem. Context determines meaning.
Processing recently summarized this problem directly: AI alone does not fix reliability; context does. Another 2026 Processing article argued that industrial AI's next value step is translating insight into action on the plant floor rather than ending at another dashboard. The same principle applies to process sensing. A useful system has to connect the physical signal to the operating state, route an understandable action, and then measure whether the action improved the result. [14,15]
That creates a simple operating sequence: detect the developing condition; diagnose likely causes; predict consequences where the evidence supports it; route an operator-approved response; verify the result. Verification is especially important because it converts an AI recommendation into measurable plant economics without requiring autonomous control on day one.
What the hybrid model looks like in practice
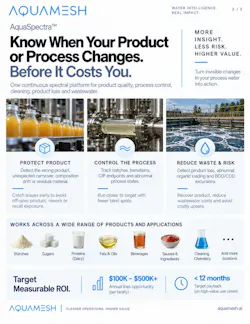
At AquaMesh, this is the architecture being implemented. The first step is to connect to the PLC, SCADA, historian, laboratory and conventional sensor data the plant already owns. If those signals are sufficient to solve the first problem, no new analyzer is required. If an economically important physical state remains invisible, AquaSpectra can be added as the targeted sensing layer, using UV/Vis and, where the chemistry requires broader compositional contrast, optional NIR. Laboratory measurements remain the calibration and ground-truth layer; the new continuous signal is interpreted in process context rather than treated as a standalone number. [16,17]
The advantage of that model is architectural rather than a claim that one instrument can measure everything. A plant does not have to choose between software that is limited to existing tags and a hardware-first project that assumes another sensor is always the answer. It can begin with software, add physical visibility only where the process is genuinely blind, keep the operator and existing controls authoritative, verify whether the intervention changed the result, and then reuse the same data and context layer for the next application. The first project is therefore designed to prove value without becoming a disposable point solution.
Make the first deployment smaller than the problem
For brownfield plants, the most scalable system is rarely the one with the longest feature list. It is the one that asks for the least new infrastructure before it proves value.
A practical deployment model can be summarized in seven steps: one expensive problem; existing data first; identify the missing physical state; add only the sensing required; diagnose across systems; keep the operator in control; verify and reuse.
The competitive consequence is subtle but important. AquaMesh is designed to avoid forcing a plant to choose between software that can only reason over existing signals and a sensor project that begins with hardware regardless of the data already available. The deployment can begin as software, become a sensing project only when the physics requires it, and preserve the resulting context for the second, third and tenth application. [17]
Industrial AI does not need another promise that an entire facility will transform. It needs a deployment model an operations team can approve one expensive problem at a time, without closing off the path to plant-wide intelligence later.
References
[1] McKinsey & Company, “Scaling digital and analytics-enabled improvements in chemicals and agriculture,” 2022. Source
[2] Deloitte, 2025 Smart Manufacturing and Operations Survey, 600 manufacturing executives. Source
[3] Processing, 2026 beverage CIP case study: 160+ cycles, 1,586 L/cycle, ~4 million L/year and ~10% shorter CIP. Source
[4] Processing, 2026 intelligent CIP article: reported 25% average cycle-time recovery and supplier-reported examples from ~$100K to $2M. Source
[5] Foods, 2026 review of NIR applications in food analysis, including water/moisture, proteins, carbohydrates and lipids. Source
[6] International Journal of Dairy Technology, 2025 review of NIR for raw-milk macrocomponents including fat, protein and lactose. Source
[7] Water Science & Technology study of in-situ UV/Vis and NIR for COD, nitrate and TSS in activated sludge and disturbance detection. Source
[8] Water Research, 2025, real-time online COD monitoring in industrial wastewater using NIR. Source
[9] 2024 tertiary-ozonation study using real-time UV/Vis for ozone dosing; reported 94.29% dosing-prediction accuracy and 16–71% COD removal. Source
[10] Industrial liquid-cooling guidance on coolant chemistry, pH, conductivity, contamination, corrosion, fouling and heat-transfer performance. Source
[11] Applied Sciences, 2025, miniaturized NIR measurement of trace water in ethylene glycol; reported 0.026% detection limit. Source
[12] U.S. EPA Method 405.1, biochemical oxygen demand, five-day incubation. Source
[13] ABB, Value of Reliability survey, 2023, 3,215 industrial organizations; reported median hourly unplanned-downtime costs by sector. Source
[14] Processing, 2026, “AI alone won’t fix reliability, context will.” Source
[15] Processing, 2026, “From insight to execution: Why industrial AI’s next breakthrough will happen on the plant floor.” Source
[16] AquaSpectra Sensor Brief, 2026. Internal product source: process monitoring/product profiling primary; calibrated BOD/COD optional; UV/Vis with optional NIR/Raman.
[17] AquaMesh company deck, 2026. Internal architecture source: existing plant data first, targeted sensing for blind spots, operator-approved workflow and reuse across plant applications.
About the Author
Alex Towfigh
Founder and CEO of AquaMesh
Alex Towfigh is founder and CEO of AquaMesh, a San Diego industrial technology company developing operational AI and targeted sensing for industrial water and process operations. AquaMesh originated from continuous-sensing R&D with Scripps Institution of Oceanography and is focused on making economically important physical process conditions visible early enough for operators to act.