How to invigorate the supply chain demand forecasting process
Hurricane Florence devastated the Carolinas in September 2018. Even though the storm originated from the west coast of Africa in August, far from its landfall, it was amazing at how well the National Hurricane Center scientists used statistical-dynamical computer models to track and predict its path and intensity by the hour across 4,000 miles. Demand forecasting is much smaller in scale and yet it is both an art and a science. It typically starts with the demand planner reviewing the statistical forecasts generated from the enterprise resource planning (ERP) or demand planning system.
Many companies use statistical models that analyze time-series data, such as moving average and Holt-Winters exponential smoothing, at a product or sub-product level. The demand planner will then override some of these statistical forecasts based on the sales and operations planning (S&OP) process after obtaining market and customer intelligence from the sales and marketing teams. The chief operating officers are happy because that level of granularity is enough for projecting revenues and earnings before income tax depreciation and amortization (EBITDA). However, the supply chain and operations executives do not benefit much from such a high-level output. In many cases, like the specialty chemicals industry, the S&OP process does not get into the next level of detailing out the item or stock keeping unit (SKU) forecasts. In other cases, the statistical forecasts from systems are either not sophisticated enough to handle non-linear patterns or no one has gone under the hood to optimize statistical parameters like Alpha and Beta. Supply chain leaders are screaming for low forecast inaccuracy at the item level, or SKU level, to effectively be used for master planning and materials requirement planning (MRP). Unless this is done, balancing service levels, manufacturing asset efficiency and inventory are almost unrealistic goals.
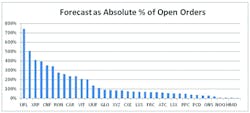
Figure 1. Forecast variance exception alert. All figures courtesy of Ravi Rajagopalan
The quest to be the best
Top quartile companies in their industry realize that an effective supply chain originates from a robust demand forecast. In the 1990s, several of these companies formed and centralized a demand planning function and invested a significant amount of capital in specialized demand planning software. However, with the start of the economic recession in 2007, sales began to fluctuate in unknown patterns, products had to be shed or new products had to be introduced, high employee turnover led to knowledge erosion and customer churns and their requirements dramatically changed. The S&OP leaders could no longer satisfy manufacturing and supply chain leadership that forecasting accuracy in low 90 percent at product-level was good enough. Better demand forecasting at SKU level as inputs to the master planning process was needed to minimize inventory while maintaining high service levels.
Best practices can be utilized to minimize demand forecast errors — a combination of analyzing forward-looking data, integrating organizational efforts, implementing a repeatable control plan, measuring error with mean absolute percent error (MAPE), nurturing customer relationships, incorporating artificial intelligence, applying statistics and setting feasible targets. The following section summarizes these best practices known as FORECAST practices.
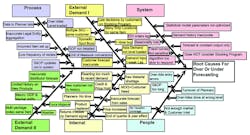
Figure 2. Fish bone diagram depicting organizational effort and potential sources of variation
Enhance your demand planning capabilities with FORECAST practices
Forward looking: While it is standard practice to use historical data to forecast future demand, there are a lot of hidden treasures in looking at open sales orders. The U.S. Securities and Exchange Commission (SEC) requires mutual funds to tell investors that a fund’s past performance does not necessarily predict future results because it is not uncommon for a fund to have its performance drop within a year. This context is no different for forecasting demand. We all know customers are finicky, mergers and acquisitions are commonplace, and sourcing leaders constantly scan the market place and source from the optimal total landed cost supplier. If there is a macroeconomic shock like the recession in 2008, demand planners are on high alert and manually adjust or override the demand, but in normal years this drop or increase is subtler and more difficult to identify. Open sales orders can provide a factual forward look by comparing them to the normal patterns.
For example, the materials manager of an assembler of material handling systems gained enough knowledge about her business to observe that 53 percent of the orders due that month are booked in the first week of the month, and another 27 percent by the end of second week of that month. Any major deviation from such a trend would attract scrutiny. For other businesses that may not have such a booking pattern, a proactive forecast variance exception alert, a visual that compares forecast quantities with open orders during the forecast period, can be deployed to alert the planner if it is greater than say 100 percent (see Figure 1).
Organizational effort: Lean Six Sigma’s Define, Measure, Analyze, Improve, Control (DMAIC) methodology is a robust approach to deploy for such an initiative since it forces a confluence of strategy, problem definition, process rigor and, above all, a control mechanism to sustain the benefits. A cross-functional team is essential to comprehend and provide an effective forecast that will be useful to the supply chain. Figure 2 is a fish bone diagram that depicts that the potential root cause(s) for forecast inaccuracy can stem from various functions inside and outside an organization. The diagram shows that involvement of employees from the departments of sales and marketing, customer service, demand planning, master planning and production, finance and accounting, information technology and other functions play crucial roles. Even during implementation of the solution, change management tools, such as stakeholder analysis and influence diagrams, will prove helpful to get buy-in from several departments.
Figure 3. Monthly mean absolute percent error (MAPE) control chart
Repeatable processes: Maintaining low forecast inaccuracy once the project is implemented has to be the ultimate objective since any benefit has to be sustained over a long term. The DMAIC approach incorporates a control phase at the end to ensure that key process indicators (KPIs), handover to functional department owners, and control mechanisms are repeatable and "institutionalized." The control plan (a modified version of failure mode and effect analysis or FMEA) should be simple and system-based. It should include mistake-proofing (poka-yoke) process steps and action items to be taken when the metric goes out of statistical process control. Standard operating procedures (SOPs) and reports lose adoption over time.
For example, the demand planner for a manufacturer and distributor of hand and power tools used control charts shown in Figure 3 on a weekly basis at a sub-product level. As soon as the monthly mean absolute percent error (MAPE) went out of statistical control (shown by the three red-dots in the moving range chart), the demand planner would trigger a set of actions using business process management (BPM) or case management software. When the case is resolved and closed by a "downstream" leader of the output of the demand forecast — like the supply chain director — then the organization can be convinced that corrective action was taken.
Error: Forecast inaccuracy is best measured with MAPE. While bias, mean absolute deviation (MAD), mean forecast error (MFE) and other metrics can be used, experience on a few projects indicate that MAPE is the most pragmatic KPI since it gives the magnitude of forecast error regardless of the direction of the inaccuracy. MAPE is also a statistic that normalizes the scale of the forecast unit by easily accommodating high and low volumes in the same dataset.
Figure 4. Design of experiments (DOE) statistical significant factors and their interaction
Customer collaboration: Collaborative planning, forecasting and replenishment (CPFR) has long been touted as the best practice to mitigate the impact of the fluctuations in sales orders on production. Well-integrated supply chains automatically convert these forecasts from customers to "planned" production orders to smooth master planning. Yet this practice still remains mostly in theory. Not having standardized data exchange interfaces to convert the forecast data from different customer formats to a company’s own ERP system, fear that asking customers to send forecasts might negatively impact relationships, bad forecasts given by some customers, etc., are some reasons for not having an effective customer collaboration for forecasting demand. One approach is to identify dominant customers of few high variation items and establish periodic communications to exchange or discuss these forecasts. Dominant customers are a few customers that contribute about 80 percent of the sales orders. Over a period of time, customers are convinced that it actually enhances the supplier-customer partnerships and mitigates disruptions in the supply chain. Blanket purchase orders from customers are a different flavor of CPFR but they aren’t found to be effective for forecasting in many instances.
Artificial intelligence (AI): For a leading chemical manufacturer, machine learning, an avatar of AI, did the trick. Instead of purchasing a new system to add demand-planning capabilities, it simply leapfrogged the existing internal legacy systems’ capabilities by implementing a machine learning algorithm. Machine learning models are a relatively new entrant to demand planning. They give the ability to add several sources of variation, illustrated in Figure 2, to the history of shipments rather than using the latter as just time-series data. It may still require industry insights and functional expertise to include the correct predicting factors and leading indicators. However, machine learning software has not reached a maturity level so that it can be used as a plug-and-play application for demand planning. Several off-the-shelf tools and libraries that can be utilized with Python or R programming languages can be powerful. The chemical manufacturer used the Keras open source neural network library written in Python. The weekly rail traffic data for freight carloads of motor vehicles and parts published by the Association of American Railroads (AAR) was used in the predictive model as a leading indicator for the shipments of their products to the automobile industry.
Statistics: Most dedicated demand planning or ERP systems use statistical models to forecast demand. Some have complicated models to choose from, so choosing the right model for a certain segment of SKUs may yield better results rather than using the same model for all SKUs. Some statistical models have parameters that need to be periodically adjusted as the business condition changes. In addition, statistics should be used extensively in several demand planning process steps. Figure 4 shows an output in Minitab Statistical software of how design of experiments (DOE) was used to find out the statistical significance of several factors and their interactions in a proprietary demand forecasting statistical model. In this case, focusing efforts on statistically significant parameters, base coefficient and trend coefficient and their interaction can lead to better forecast. It also shows seasonality effects do not have much of an impact on the forecast. Earlier we discussed how control charts depicted in Figure 3 can be used to determine if any process is in statistical control or not.
Target: Goals to be achieved for forecast inaccuracy should be set based on internal past performance rather than external benchmarks. A plastic resin compounding manufacturer found it daunting to obtain the monthly SKU-level MAPE benchmark for its industry. Product lines vary from company to company even within the same industry, forecast periods are measured differently (monthly versus quarterly versus every six weeks), and the product level hierarchy at which forecast is measured (product level versus sub-product level versus item level versus SKU level) are disparate. Earlier, it was noted that even the forecast errors are measured differently. Hence, it is better to set a target based on past performance achieved within the company or strategic business unit like 50 percent improvement from current MAPE rather than industry benchmarks.
Takeaway
Merely depending on the output from a demand forecasting system may not yield the desired results, especially if a sound SKU-level forecast is crucial for supply chain. There are several other tools in your toolbox that can be used to make incremental improvements. Predicting demand will always be a tough task as long as your customers have to deal with constant changes to business conditions. But the risks to disruption in the supply chain or high working capital costs can be mitigated by looking at the challenge in different ways and adopting new methodologies as a team.
Ravi Rajagopalan is a professional with supply chain management and sales and relationship management experience. His supply chain management expertise spans planning, manufacturing and operations, distribution, Lean Six Sigma continuous improvement, purchasing, supplier management, strategic sourcing, inventory and materials management. Rajagopalan’s sales and relationship management experience includes new business development, practice and alliance development, and account management. He has worked in several industries including plastics, electrical utilities, manufacturing and distribution, retail, business services and rail transportation. Rajagopalan is a certified Black Belt consultant and may be reached at [email protected] or [email protected].


