Vibration monitoring using a current loop and PLC
The use of vibration monitoring for machinery health analysis and diagnostics is common practice in most industrial facilities. A vibration monitoring program can include one or more of the following methodologies:
Route-based: Vibration data collection points are identified and mapped out on a route. Technicians move from point to point, taking data with an accelerometer with a VAC output and a portable data collector.
Permanently installed: Accelerometers with a VAC output are permanently installed and wired back to a data acquisition system.
Process monitoring: Vibration transmitters with a current output are permanently installed and wired back to a programmable logic controller (PLC), distributed control system (DCS) or supervisory control and data acquisition (SCADA) system.
Because of the widespread use of PLCs in industrial facilities for other purposes, it is commonplace for maintenance and reliability technicians to choose to use vibration transmitters as their sensor of choice because of their ability to integrate seamlessly into the existing system and provide a continuous signal that can be monitored, recorded and trended as needed. Prior to vibration transmitter selection, it is crucial that a technician understand the different scaling options available for vibration transmitters (root mean square [RMS], peak and true peak).
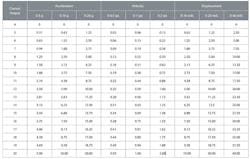
Table 1. Common acceleration, velocity and displacement measurement ranges and their corresponding current output value
The role of the vibration transmitter on a current loop
Like most current loops, a current loop dedicated to vibration monitoring consists of three major component types with wiring connecting them together:
- VDC power supply
- Vibration transmitter(s)
- Resistor
The power supply (typically 24 VDC) supplies current through the system. Each transmitter, which has a specified measurement range, controls the current flow to allow through only the amount of current corresponding to the vibration measurement at the time. The current then flows through wiring to the resistor, where it is converted into DC voltage. The resistor is typically sized at either 250 Ohms (Ω) for a resulting 1-5 VDC signal or 500 Ω for a resulting 2-10 VDC signal.
Vibration transmitters commonly have measurement ranges in acceleration, velocity or displacement. Table 1 illustrates the most common acceleration, velocity and displacement measurement ranges and their corresponding current output value.
Figure 2. The positive and negative half cycles of an AC waveform are divided into many slices, each small enough to represent a constant voltage.
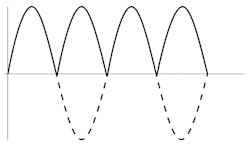
Figure 3. Squaring each of the individual waveform slices will cause the negative portions of the waveform to become positive.
The signal conditioning process of a vibration transmitter
The signal conditioning process of a vibration transmitter is similar to that of an integrated electronics piezoelectric (IEPE) accelerometer and starts with the sensing element producing a high-impedance charge output after being acted upon by a force. The charge is collected in the crystal capacitance and is converted into a low-impedance voltage signal by the amplifier.
The low-impedance voltage signal is an AC voltage signal (typically 0-5 VAC for a sensor with a 100 mV/g sensitivity) that rides on top of the DC bias voltage until decoupling occurs. The AC voltage signal swings in both the positive and negative direction. In the negative direction, the voltage swing is from a sensor-specific lower limit to the bias voltage. In the positive direction, the voltage swing is from the bias voltage to the excitation voltage.
The measurement range of the AC voltage signal can stay in acceleration or it may be integrated into velocity or double-integrated into displacement. It is then scaled to the specified measurement range as referenced in Table 1. The AC voltage signal is subsequently converted into a DC voltage signal via either the RMS or the rectification/peak capture methodology. The DC voltage signal is then subsequently converted to a 4-20 mA current signal.
The conversion of the AC voltage signal to a DC voltage signal is the primary determinant of the resulting current signal’s scaling. It’s not as simple as averaging the individual AC voltage signal values because, for sine waves with equal positive and negative half cycles, this averaging would result in a nonvaluable measurement of zero. If the signal is converted via the RMS methodology, then the resulting current output will be scaled in either RMS or peak. If the signal is converted via the rectification/peak capture methodology, then the resulting current output will be scaled in true peak.
Before taking an in-depth look at the steps involved in each of the two methodologies associated with converting AC voltage to DC voltage, let’s first review the difference between the three scaling options.
- RMS: Arithmetic average of all amplitudes captured in the time period
- Peak: Arithmetic average of all amplitudes captured in the time period times 1.414
- True peak: Truly highest amplitude peak in the time period
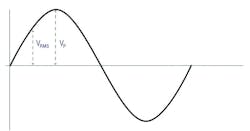
Figure 4. RMS scaling represents 70.7 percent of the energy under the waveform curve while peak scaling represents 100 percent of the energy under the waveform curve.
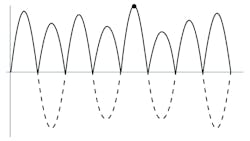
Figure 5. In the rectification/peak capture methodology, all negative portions of the waveform are converted to positive after which the highest amplitude is identified.
Root mean square methodology
The RMS methodology consists of these four calculation steps:
- Divide one cycle (i.e., one positive and one negative half cycle) of the AC waveform into many slices, each small enough to represent a constant voltage during the time period. See Figure 2.
- Square each of those individual constant voltages. This squaring of each individual voltage converts all voltages, regardless of whether originally positive or negative, to positive values. See Figure 3.
- Calculate the mean (average) of the squared values. See Figure 4.
- Calculate the square root of the mean. The result is the RMS DC voltage value.
From the RMS DC voltage value, both peak voltage (VP) can be calculated based on the below equation. As with the above RMS DC voltage equation, the below equation can only be used if the waveform in a sinusoidal wave.
VP =VRMS×√2=VRMS×1.414
Rectification/peak capture methodology
For applications where the truly highest amplitude peak in the time period needs to be identified (i.e., bearing, reciprocating compressor and other metal-to-metal impact monitoring), the AC voltage signal is converted into a DC voltage signal via the rectification/peak capture methodology rather than the RMS methodology. The rectification process converts all negative half cycles of the waveform to positive half cycles of equivalent amplitude. The peak capture function then scans all positive half cycles during a given time period and captures the highest amplitude as the true peak value.
Figure 6. Vibration monitoring of reciprocating compressors typically requires a true peak current output rather than an RMS or peak current output.
Conclusion
A vibration transmitter produces a current output that can be easily monitored, recorded and trended as needed by a PLC, DCS or SCADA. The current output scaling (RMS, peak or true peak) is dependent upon what methodology is used to convert AC voltage to DC voltage during the vibration transmitter’s signal conditioning process.
Meredith Christman is currently the product marketing manager for IMI Sensors, a division of PCB Piezotronics Inc. In that capacity, Christman is responsible for product development and management of the company’s industrial and energy product lines that include accelerometers, 4-20 mA transmitters, pressure transducers and switches. Prior to her current role, she worked for 10 years as product manager of air management products with Roberts-Gordon, where she was responsible for product development and management of the company’s DOAS cooling and indirect-fired heating equipment. Christman graduated in 2003 from the University at Buffalo School of Management with an MBA in finance and international management. She completed her undergraduate education at Canisius College in 2001.

