Reduce emissions by improving sulfur recovery unit performance with self-service industrial analytics
Oil and gas companies are continuously striving to optimize overall equipment effectiveness, performance and profitability within a highly volatile and regulated environment. Several of those regulations are coming from an increasing industry effort toward the reduction of emissions that affect both health and the environment. And these initiatives are growing from both industry and governmental groups.
For example, oil and gas companies that operate in the UK Continental Shelf (commonly known in the North Sea) are stepping up to reduce carbon emissions to net zero by 2050 in the UK. Another example is the decarbonization efforts led by the European Commission, which aim to initiate the transition toward “a climate neutral economy” by 2050. This will require the active involvement and investment of different industry, technology and governmental sectors for mid- and long-term solutions. To start getting results today, it is key to take advantage of underutilized data in combination with process expertise that is already in place, aiming to improve process workflows to have a better and more efficient emissions control and reduction.
There is an increasing need to exploit the large set of data being generated from sensors, instruments and assets. Traditional methods of “big data” solutions require complex IT projects and data scientists to build and maintain models. Aside from being costly and time-consuming, this way of working can also create resource bottlenecks in the organization and underutilize the process and asset experts. Turning big industrial data into actionable information may seem like a huge task — but self-service industrial analytics makes it easy for process engineers to optimize the processes by themselves. Results are delivered quickly and directly into the hands of the process experts who can really provide meaningful interpretations to the data, allowing them to uncover insights at all levels of production, improving day-to-day decision-making.
Case in point: Process experts improve SRU performance
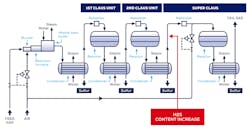
This article is focused on a unit that is present in all refineries and gas plants. Sulfur recovery units (SRU) are becoming more and more important not only due to the rising demand for sulfur in various applications, but mainly due to the increasing concern and number of regulations around emissions control and climate change. SRUs typically include burners, catalytic stages and most of the time a Superclaus unit and a tail gas incinerator. The Claus process partially burns the Hydrogen Sulfide (H2S). It then converts catalytically the H2S and the Carbon Dioxide (CO2) combustion products to elemental sulfur and water vapor. One of the most important process KPIs is the sulfur recovery. Low process efficiency (in this case, lower than 99.2) results in lower sulfur recovery and unprocessed and unwanted H2S and sulfur dioxide (SO2) emissions.
The next paragraphs will explain how process engineers can monitor and increase the SRU operational performance by using self-service industrial analytics, without the need of complex Excel sheets or long data-modeling projects.
Analyzing the data
A prerequisite for data analytics is to have the data readily available through a live connection to the historian to automatically visualize the tags in user-friendly trend views. The next step is to start the data exploration and searching for specific process events in the SRU throughout multiple years of data. With the use of modern self-service industrial analytics software, the process expert can focus on discovering the periods of low sulfur recovery over the last two years.
The process expert will search for and visualize the low recovery periods, focusing on the H2S content behavior. The sulfur that is recovered has a high dependency on the H2S content that is measured before the Superclaus unit; whenever the H2S online analyzer has sudden increases, the sulfur recovery rate will decrease. In this use case, the search showed 15 periods of low recovery, out of which nine presented a similar increase pattern of the H2S content.
The process expert decided to set up a monitor to follow the pattern of sudden increases of the H2S content independent of the absolute value. Through patented pattern recognition technology, the process expert identified particular behaviors for periods longer than 20 minutes. By saving the search, the H2S content behavior can be monitored in real time.
Each time a user-configurable percentage of similarity is matched, an alert via email is sent to the operator to take appropriate measures to control the process.
Operational context accelerates root cause analysis
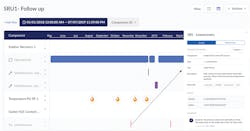
The monitor created by the process expert, running in the background, can be used to capture specific “low recovery” events, which can be combined with other operational contextual data from other systems. This can be shown in a Gantt chart view [Figure 2] that gives the users a quick overview of information from the Manufacturing Execution System (MES) for operational status of the unit in combination with maintenance periods, operator manual entries of high skin temperature in the reactor furnace and automatic logins coming from the monitor of the sudden increase of the H2S content.
All this information can be used to create an analytics-driven production cockpit [Figure 3]. Looking at a timeframe (in this case one week) set by the user containing the live status of the H2S content as an alert, a quick overview is provided to all relevant time-series data following the sulfur recovery in MT/D (megatons per day) and the total steam production in lb/h, as well as several temperature measurement upstream of the Superclaus. Lastly, the operator has access to a counter that shows the history of the behavior of the H2S content alert for a determined period of time.
In this use case, with the dashboard in place for the control room, an increase of H2S was detected for more than 20 minutes, triggering the H2S status alert. During the shift handover it was decided to further investigate the issue with the self-service analytics software. With just one click on the alert tile, the engineers moved to the time-series data universe to start a root cause analysis with the timeframe and tags of interest available.
Because the issues were not immediately clear by using the tags around the H2S content analyzer, it was decided to look further upstream. Instead of trial-and-error, the self-service analytics software can suggest root causes by use of the recommender engine. In this use case, the recommender engine suggests a strong negative correlation between the operating temperature of the first Claus unit and the H2S content value. An immediate call to action to bring the process and the recovery back, is to check fluctuations in the sulfur flow and steam around the first Claus unit, and/or increase the process its inlet process gas temperature.
Continuous improvement; closing the analytics loop
With the low operating temperature of the first Claus unit identified as the root cause for the increase in the H2S content, and therefore low sulfur recovery during the last shift, it is then time to look into the last four events of H2S increase that happened throughout the last week. Looking into the data for those periods lets the expert conclude that there is a more consistent problem with the operating temperature of the first Claus unit. A deeper analysis of the flow measurement and control loops tuning takes place but no immediate deviation is spotted.
As a complement for the consequent process discussions, a quick look by using the recommendation engine for all four periods confirms a hypothesis that the root cause could then be on the utility side (steam) of the SRU unit. In comparison with the process side of the unit, the utility side is frequently neglected in both the details of the conceptual design, and in the normal day-to-day operation.
The process team then focused on looking at a heat loss in the steam side, and after a field checks it found that there is a problem with one of the steam traps. This resulted in the creation of a monitor set on the operating temperature of the first Claus unit with the recommendation for the operator to look into the steam side. More specifically, looking at the steam traps around it to manually check the temperature measurement at the inflow of the trap and at the condensate side of the trap. As an extra outcome of the analysis it was decided to double check the preventive maintenance program for the steam trap.
Conclusion
The self-service analytics tool has helped the process expert to easily visualize and monitor the process, assess the size of the problem, drill down to a series of root causes and, finally, set up a monitor to prevent the issue from happening in the future. There was no need for a long multi-disciplinary data analytics project — the process engineers could easily do all the data analytics themselves, including the use of contextual data from other business applications to easily create a production cockpit to monitor, control and improve the process. This helped reduce emissions, maintenance costs and production losses.
Julian Pereira is head of customer success EMEA at TrendMiner and a process chemical engineer by education. Pereira has built his key industrial process expertise by delivering a variety of on-site engineering solution services around the globe for Oil & Gas, petrochemical and manufacturing processes. Among his expertise, Pereira has 10 years of experience in process simulation and optimization, energy optimization and integration, data analytics and continuous improvement. Currently Pereira is helping the industry to work toward a successful digitalization journey with TrendMiner.


