Applying advanced analytics to minimize emissions in the oil and gas sector
There is a critical transformation occurring in the oil and gas industry today, as companies are decarbonizing their operations at record rates. While certain investments are critical for measuring and reducing emissions, most organizations can build on their current foundations to start making an immediate impact.
Paired with the expertise of their subject matter experts (SMEs), oil and gas companies can leverage advanced analytics applications to gain new visibility into their process data, helping minimize emissions with little to no capital investment. These solutions can be used to build models for a better understanding of how changes to their processes will affect environmental performance, including emissions.
By implementing these solutions, refining and petrochemical companies can minimize their emissions in three ways:
- Preventing emissions events before they happen.
- Identifying events immediately when they begin, and diagnosing the root cause to quickly take corrective action.
- Automating regulatory reporting, which empowers teams to focus on accelerating the path toward sustainable operations.
- In this article, we will examine these three strategies, along with a case study for each.
Preventing emissions in process operations
The clearest way to minimize operations-based emissions is to prevent them from occurring altogether, but achieving this is quite complex. Successful prevention depends on three major components:
- Access to enough data to build a predictive model, along with a selected soft sensor or key performance indicator for detecting anomalies, to provide advanced warning of an impending emissions event.
- A model that is accurate and sophisticated enough to provide the relevant insight to quickly diagnose and correct anomaly-causing conditions, as well as ample time to make the required process adjustments.
- Trust that the model is guiding operations in the right direction.
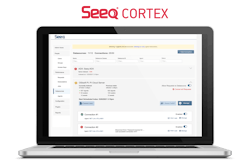
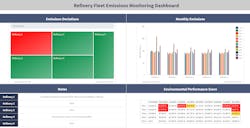
Providing teams with access to the necessary data for building these models often involves piecing together information from multiple systems to see the big picture. In the past, this was performed by querying multiple plant historians and databases that lacked connectivity to new data as it was generated. By contrast, advanced analytics applications (Figure 1) solve this challenge by providing access to all data sources simultaneously — including plant historians, lab databases, regulatory agencies and maintenance management systems — from a single location, while maintaining live connections for automatic updates in near real time.
Once SMEs have access to the data required, they are tasked with the challenge of creating an intelligent model capable not only of alerting, but also generating root cause insights that guide operational decisions and adjustments. The first step for building a trustworthy model is to keep engineers involved in the workflow with operations staff. Deploying a black box machine learning algorithm developed by a data scientist in a silo too frequently amounts to false alerts — causing frustration among operations — or incomplete insights, which fail to provide helpful guidance for operations and maintenance.
Addressing these and other issues, self-service analytics tools empower SMEs to use point-and-click and low code tools to conduct calculations and create models collaboratively. By displaying information from all relevant data sources, these applications make it easy to identify unique periods of interest in the data, from which anomaly detection can be refined. Working with operations staff, SMEs can ensure helpful context is included with alerts to guide informed decision-making and productive process adjustments to prevent or quickly mitigate emissions.
Fuel gas monitoring model to prevent boiler flooding events
Many plants have boilers or furnaces at their sites that use fuel gas, which is often comprised of 10-30 different sources from the various units. Flooding can occur in this equipment when excess oxygen drops below a certain level, causing an unsafe operating state. If this condition goes unresolved, the equipment must shut down, resulting in unnecessary flaring and emissions.
A refinery operator experienced a flooding incident during a startup, right after procuring Seeq, an advanced analytics application. After the emissions event transpired, an incident investigation was launched to identify causes. This investigation took only one day using advanced analytics tools, instead of the usual one week or longer to identify root causes when manually wrangling and analyzing data with spreadsheets.
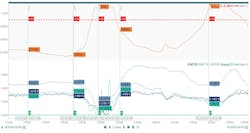
Equipped with a live connection and a central location for all of their data, the team continued to run root cause analyses, refining their findings and generating new insights over time. By incorporating these learnings into a statistical model, the team achieved proactive identification of impending similar events prior to occurrence. The model not only alerts operators of coming events, but also guides them to the source of the potential upset (Figure 2).
The operations team incorporated this new monitoring tool into their startup procedure, armed with new insights. By deploying and relying on this SME-developed model, operations staff successfully addressed the conditions of an impending emissions event during a subsequent startup a month after the first occurred to prevent a second event.
Minimizing the impact of ongoing environmental events
Operations in oil and gas can result in unexpected swings and changes that cannot always be anticipated, due to the nature of the processes. Unfortunately, this means emissions events cannot always be completely prevented in the field, but they can be curtailed.
The second way to reduce emissions is to identify events immediately as they begin, diagnosing the root cause quickly so prompt corrective action can be taken. Leveraging an advanced analytics model is again a key element of the solution, as it can generate alerts and accompanying insights as soon as an emissions event begins, providing enough contextual data for responders to minimize the event duration, and subsequent impact to the environment. With quick diagnosis and mitigating measures, organizations can minimize the overall emissions at their facilities and reduce expenditures.
Excess flaring mitigation
Flares are safety devices, present at many facilities to relieve tank pressure, preventing over-pressure events and managing unexpected operational upsets. But flaring above design purge requirements wastes valuable energy, and it adds to greenhouse gas emissions.
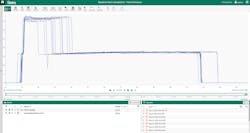
At a large Canadian refinery, the process engineering team struggled to identify the targets and boundaries for flaring because operational states and conditions changed over time, and no baseline parameters were ever established. After deploying Seeq, the team began identifying periods of time when equipment was on and running at high flow rates using Capsule capabilities (Figure 3). The SMEs were then able to use average flow rate as a baseline for proper operation of the flare stack. With a live connection to all real-time and historical data, the team was able to analyze over 10 years of data in a short period of time, with updates streaming in constantly.
After establishing a baseline, the team created a model to alert operations staff when flare loads crossed the baseline. When this occurred, the SMEs could examine the various flaring sources and identify those out of alignment.
This model enabled the team to rapidly detect even the smallest of flaring sources, such as open valves at a sample station. The ability to identify baseline exceedances quickly and guide operations directly to the source is saving the company CAD $1.2M per year in reduced flaring.
Automating regulatory reporting
The third method for reducing emissions has everything to do with data analyst and SME time allocation. According to Anaconda’s 2021 data science survey, an estimated 39% of experts’ time is spent on data prep and cleansing, which suggests many workflows — including regulatory reporting — are still conducted manually.
Automation of data conditioning and subsequent reporting can free up significant chunks of SMEs’ time to spend instead optimizing operations and improving plant efficiency. These types of efforts can reduce both operating expenditures and emissions.
Workflow automation
At a super-major oil and gas company, SMEs leveraged Seeq to automate their regulatory compliance reporting for greenhouse gas emissions across their refineries. The application accesses data from the refinery historians and applies calculations and contextualization for quarterly regulatory emissions reporting. Extensibility in Seeq empowered the team to build a custom export tool for extracting final emissions data, formatting it for direct ingestion into their corporate greenhouse gas reporting software (Figure 4).
By applying an advanced analytics solution, the company reduced manual reporting time and efforts significantly. Using spreadsheets previously, these reports took days for SMEs to compile and analyze.
Now, with automatic calculations and real-time updates incorporating the latest data, analysis typically requires only a few hours. And more importantly, the up-to-date and readily available emissions performance information is empowering the company to shift from a reactive to a proactive emissions identification approach, enabling emissions prevention in some instances, rather than simply reporting after the fact.
Why wait, accelerate!
Oil and gas operators will continue to face pressure to minimize and even eliminate emissions as time goes on. There is no denying the path to achieving net zero carbon emissions will be arduous, but the best way to accelerate the transition and overcome the obstacles is beginning with effective modern tools available now.
Refining and petrochemical companies can remain stagnant with traditional tools for monitoring and reporting emissions, or they can empower their teams to make step changes today by implementing advanced analytics solutions, transforming the ways in which they operate. Once equipped with advanced analytics and access to the necessary data, these organizations can proactively identify and prevent emissions before they occur, or reduce emissions with rapid mitigation as soon as an event begins.
These applications also free up SMEs’ workloads by automating many previously manual data conditioning and reporting tasks, providing more time to focus on innovative solutions for optimizing operations and reducing emissions. These steps contribute to sustainability outcomes today, and at the same time, set the stage for future strategies, technologies and innovations to help the industry achieve ambitious net zero carbon goals.
Morgan Bowling is an industry principal at Seeq with nearly a decade of experience working at both independent and integrated major oil and gas companies to solve high-value business problems leveraging time series data. In her current role, she enjoys monitoring the rapidly changing trends surrounding digital transformation in the oil and gas industry, and translating them into product requirements. Morgan holds a BS in Chemical Engineering from the University of Toledo.
Seeq
About the Author
Morgan Bowling
Industry principal at Seeq
Morgan Bowling is an industry principal at Seeq with nearly a decade of experience working at both independent and integrated major oil and gas companies to solve high-value business problems leveraging time series data. In her current role, she enjoys monitoring the rapidly changing trends surrounding digital transformation in the oil and gas industry, and translating them into product requirements. Morgan holds a BS in Chemical Engineering from the University of Toledo.
