Modern tools for control valve sizing
Valve sizing and proper application of control valves have always gone hand in hand. However, the tools available to valve users have changed and improved significantly over time. In the past, control valve sizing calculations were performed with specially designed slide rules. Some of these slide rules are still around today and date back to the late 1930s, before the concept of Cv had been introduced. The industry progressively adapted with the introduction of new technologies.
Around 1978, several valve manufacturers were offering programs for the HP97 programmable calculators, and many of which included noise calculations. After that, the Hewlett Packard personal computer (PC) appeared and several valve manufacturers began offering sizing programs for the PC. At first these were rudimentary, requiring the user to input specific valve parameters such as FL and xT, and once a Cv was calculated, the user had to look up that value of Cv in the manufacturer’s tables to determine which size valve would operate at acceptable degrees of valve travel. Once this had been determined, the values of FL or xT usually had to be manually adjusted. In addition, corrections to Cv and FL or xT for the effects of pipe reducers were often missing or incorrectly implemented. Since the formulas for the corrections to Cv and FL or xT for the effects of pipe reducers contained Cv, the quantity to solve for, it was necessary to do an iterative calculation. This was a time-consuming process with the original, slow computers.
Control valve sizing software
Today, control valve software from most manufacturers is quite mature, meaning the program includes all the necessary valve parameters and reduces the sizing process to only one or two steps for the end user. Some valve sizing software even makes a recommendation as to which size of valve it thinks is the best choice. The downside of having all the parameters in the software is that most manufacturers can only effectively size their own valves, although some manufacturers provide software that includes data for generic valves of the most common styles.
Perhaps the newest and most powerful tool that is included in a control valve sizing software package is the ability to graph both the installed flow characteristic and the installed gain of a particular valve in the system into which it is to be installed. The program draws two vertical lines on the installed characteristic graph to represent where the specified minimum and maximum flows (80 gpm and 550 gpm, in this example) fit on the valves characteristic graph.
Figure 1. Installed flow characteristics and gain of two segment ball valves installed in a system with a significant amount of pipe and a centrifugal pump
Figure 1 shows the installed flow and gain of two sizes of a segment ball valve in a proposed system that has a lot of pipe and a centrifugal pump. This means that as valve travel and flow changes, the pressure drop across the control valve also changes.
With the 6-inch valve, there is a lot of wasted flow capacity beyond the maximum flow of 550 gpm that is costly and unnecessary. There is also not much of a safety factor on the low end. The 3-inch valve is using a much greater portion of its total stroking range, and the minimum and maximum specified flows are symmetrically placed on the valve’s installed flow characteristic. With the 3-inch valve, there is about the same amount of safety factor at each end of the specified control range.
The real story of how well a valve will control the process is in the installed gain graph. The scaling of the ‘x’ axis is in units of q/qm, ‘q’ being the actual flow and ‘qm’ being the maximum specified flow. Within the specified flow range of 80 to 550 gpm (between the two vertical lines), the gain of the 6-inch valve changes quite a bit. The more the gain changes, the harder it will be to find one good set of controller tuning parameters that will give both tight control and stable operation over the entire flow range. At about 70 percent of the maximum specified flow, the installed gain peaks around 3.5. A 1 percent position error will cause a 3.5 percent flow error so, ideally, the gain should be as close to 1.0 as possible to make the flow less sensitive to position errors. The installed gain of the 3-inch valve is much more constant than that of the 6-inch valve and is closer to the ideal 1.0. This makes it much easier to tune the loop for fast but stable control throughout the specified flow range. The peak of 2 means that a position error of 1 percent would give a flow error of 2 percent as opposed to the 3.5 percent error of the 6-inch valve.
Sizing rotary control valve actuators properly is essential to ensuring accurate control and that the valve will shut off tightly when it is required to do so. Oversized actuators can cost more than necessary, add unnecessary weight to the control valve assembly and do not respond as quickly to changes in control signals as properly sized actuators would. Undersized actuators, at best, will not be able to accurately control the valve, move the valve at all under high process loading or shut off the process tightly when the valve is closed.
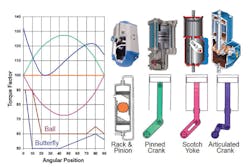
The four most common types of mechanisms for converting linear to rotary motion are the rack and pinion, pinned crank, scotch yoke and articulated crank pictured in Figure 2 (see top of page). Although spring-return actuators are the most popular for modulating control, starting out with double-acting actuators makes it easier to understand the relative advantages of each and how their conversion mechanisms work. The spring-return versions have similar torque versus position characteristics, except their torque versus position is distorted by the presence of the spring.
The motion conversion mechanism of the rack and pinion actuator is gear teeth attached to the pistons turning a gear (the pinion). The moment arm distance between the rack and the center of the pinion remains constant at all times, so the torque output is constant at all degrees of opening (see orange line in Figure 2). In the pinned crank mechanism, the connection at the piston is pinned and free to rotate. This means that at the beginning and end of rotation, the moment arm is shorter than at the middle of the stroke, so the torque output curve is the lowest at the beginning and end of rotation and peaks at the center of the stroke (see blue/green line in Figure 2). For a scotch yoke mechanism, the stem attached to the piston is constrained to move in a straight line, meaning the moment arm is the longest at the beginning and end of the stroke, and shortest at the middle of the stroke where the piston moves downward and the connection to the crank arm slides in the slot toward the rotating shaft (see pink line in Figure 2). In comparison, the geometry of the articulated crank is complex and produces a complex torque output curve (see blue line in Figure 2).
In each case of converting mechanisms in Figure 2, the torque curves are plotted with the rated, or nominal, torque at 1.0 on the graph. The torque requirement for a typical high-performance butterfly valve is greatest when the disk is coming out of or going into the seat. Torque requirement drops significantly when the disk has cleared the seat. Dynamic torque caused by flow interacting with the disk peaks somewhere around 80 degrees. The maximum torque requirement was arbitrarily drawn at 90 percent of the rated actuator torque because actuators are typically selected to have at least a 10 percent safety factor. Rated actuator torques and valve torque requirements are usually conservative. Only a small safety factor is necessary, especially for on-off valves where the main consideration is getting the valve in and out of the seat. The ball valve torque requirement is similar in shape to that of the butterfly valve. When seating and unseating, the ball valve has several degrees of “dead angle.” This is where the ball is turning but the waterway in the ball is fully covered by the seat and there is no flow, so the full shutoff pressure is pushing the ball into the seat. It is also important to note that the ball valve torque does not drop as low as the butterfly because the ball is always in contact with the seat.
Comparing the torque curves of the four motion conversion mechanisms with the torque requirements of the two common rotary valves in the example shows factors that need to be recognized when selecting and sizing a suitable actuator. The rack and pinion needs to be sized so that its constant torque has a satisfactory safety factor (typically 10 percent) above the required seating and unseating requirement of the valve. To get smooth and accurate control with the valves, a good rule of thumb is to make sure the actuator isn’t using more than 40 to 60 percent of its available torque in the throttling range. This gives the pinned crank an advantage because as long as it is sized with adequate torque for getting in and out of the seat, it has plenty of spare torque in the throttling range where it is needed for good control. Although the scotch yoke’s torque curve matches the requirements of the two valves in the example, if it is sized based on the small safety factor usually needed for getting into and out of the seat, it offers the least in the way of spare torque for the best control. The articulated crank is interesting because it has lots of safety factors getting into and out of the seat and accurately follows the intermediate position requirements.
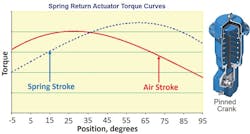
Most spring and diaphragm rotary actuators use the pinned crank mechanism; therefore, they have a torque curve that peaks somewhere in mid stroke, as shown in Figure 3. The torque curves of spring-return actuators are made more complex by the addition of the spring forces. The curves are different for the air stroke where air is generating torque but fighting against the spring whose opposing force increases as the actuator rotates, and the spring stroke where the spring force is generating torque but the force decreases.
Figure 3. Typical torque curve of a spring-return actuator with a pinned crank motion conversion mechanism
When selecting an actuator that has enough torque to get a valve into and out of the seat, the decision must be based on the lower torque at the end of stroke. For example, if the valve is to be spring-to-close, the actuator would be selected based on the torque at the end of the spring stroke to ensure that the actuator can reliably close the valve. For a valve that is to be spring-to-open, the end of air stroke torque is the one that has to be used to select the actuator.
For many years, valve manufacturers have published tables of valve size, process pressure differential and actuator size to help users select an appropriate actuator for a particular application. In general, these tables often result in satisfactory actuator performance, but recently valve manufacturers have been developing actuator sizing software that includes mathematical analysis of actuator geometry, valve geometry and dynamic process forces acting on the valve to accurately recommend the best actuator for a particular valve and process.
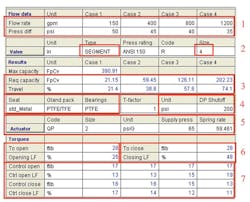
Figure 4. Computer program that analyzes valve and actuator geometry and process forces acting on the valve
Figure 4 shows the results of a computer analysis of valve sizing parameters and actuator geometry and process dynamics acting on the valve. Based on process conditions and valve type and size, the program calculates the percent of valve travel at each given flow condition, or in this example, valve travel ranging from 21.4 percent to 74.1 percent (see boxes numbered 1, 2 and 3 in Figure 4). Based on process conditions and valve construction (Box 4) the program calculates the required seating and unseating torques (Box 6). The torque required to make small opening and closing throttling adjustments at each of the given process condition points is also calculated (Box 7). Using the torque output curve calculated for the selected actuator, the program calculates the seating and unseating load factors and throttling load factors. The load factor is defined as the percentage of the available torque from the actuator at the percent of travel that is required to move the valve.
Conclusion
With industry processes constantly evolving, the tools to maintain and control those processes will continue to evolve as well. Efficiency and profitability depend on the proper sizing and installation of the process elements like control valves and actuators. Naturally, the tools used to ensure proper sizing will continue to develop with the rest of the system.
Jon F. Monsen, Ph.D., P.E., is a control valve technology consultant for Valin Corporation with more than 30 years of experience. He has lectured nationally and internationally about control valve application and sizing, and he is the author of the chapter on “Computerized Control Valve Sizing” in the ISA Practical Guides book on control valves. He is also the author of the book Control Valve Application Technology: Techniques and Considerations for Properly Selecting the Right Control Valve.


