How to troubleshoot pump noise & vibration, part 2
Visit Part 1 of this article by clicking here.
In Part 1 (Processing, November 2016), a waste collection system in State College, Pennsylvania, was investigated to determine why excessive noise and vibration occurred in three recently added backup pumps. Using vibration monitors with wireless technology and a thorough inspection of the system, the Penn State capstone design team developed a piping system simulation of the actual piping system using commercially available software. Part 2 of the series focuses on how the information from the wireless vibration technology and piping system simulation helped the team gain a better understanding of what was happening in the physical system and what modifications could correct the problem.
Understanding what was happening in the system
As discussed in Part 1, the first indication of trouble was the report of severe cavitation when operating the new backup pumps. Test results using wireless vibration sensors on the backup pumps showed cavitation did not start on any of the pumps until they had been operating for more than 10 minutes. Initial models of the system indicated it was missing some critical elements and predicted flow rates much higher than expected. However, this theory did not address the 10-minute delay before the behavior started and did not yet show the root cause of the cavitation.
Refining the system model
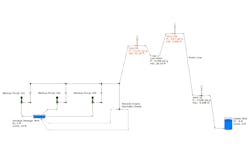
The next step was for the Penn State student interns to expand the model in the simulator program to include all piping and fixtures downstream from the pump suction piping. The team discovered that the pipeline from the backup pump discharge had two high points: Vent 85 (elevation 85 feet above datum) and Vent 100 (elevation 100 feet above datum). Vent 15 (elevation 15 feet above datum) was also added and was located upstream of the outlet tank in the down line.
All vents were installed with vacuum and pressure relief valves. This additional design information was easily added to the model and, when all the required information was entered, PIPE-FLO® Professional was used to perform the calculations and displayed the results in Figure 1.
The Penn State team reviewed the results and noted that Vent 85 required a negative 14.1 psig for the system to operate, and Vent 100 required a negative 39.7 psig for the system to work properly. The program gave multiple calculation warnings that the model could not simulate what was happening in the physical system. The Penn State interns asked why the program provided a set of results that could not possibly occur.
The simulation was based on the basic engineering calculations, and these methods had specific ranges and limitations. If any of the ranges or limitations of the equations were exceeded, the model provided a message indicating it was unable to properly simulate the system as defined by the boundary conditions of the actual piping system entered. With the boundary conditions present in the real system (the liquid level in the storage tank 10 feet above the datum elevation, the liquid level in the outlet tank 3 feet below the datum elevation, and the three backup pumps operating), the program calculated the energy at Vent 85 and Vent 100 (shown as HG on the schematic in Figure 1).
The warning at Vent 85 was because, for the energy level determined at this location, the pressure must have been -14.1 psig. This value was below the vapor pressure of the fluid flowing at this location. As a result, the fluid at this location changed phase from a saturated liquid to a fluid with a liquid and vapor phase, resulting in two-phase flow. The Darcy method used by the simulation was valid for singlephase flow of liquids and gases, but it did not solve for two-phase flow.
At Vent 100 the pressure, again, would need to be -39.7 psig with the stated boundary conditions. This is well below the lowest possible gage pressure corresponding to the physical limit of 0 psia. As a result, the simulation software was unable to model the system; however, the program displayed all the calculated results in order to aid in troubleshooting the model.
Based on these preliminary calculations, it appeared that, in the physical system, the installed vacuum relief valves would open, but no operator’s confirmation was available. These results also did not explain why the backup pumps experienced cavitation only after 10 minutes of operation.
A secondary run was scheduled with operators and interns located by the backup pumps and at the vent relief valves at Vent 85 and Vent 100 to see if they opened as predicted by the model. Plant instrumentation was limited, so only the operating data listed in Table 2 was gathered.

Table 1. Data provided by the second operational test
Image Courtesy Of Engineered Software Inc
What was happening in the system?
Using the data in Table 1 and the piping system model, the capstone project team found the following:
- The operators confirmed that the discharge pipeline was normally empty when the system was shut down for extended periods. Using this information, it was calculated that approximately 8 minutes were required to fill up the discharge pipe to Vent 85.
- After reaching Vent 85, the fluid started flowing down to a low point (elevation not provided) located between Vent 85 and Vent 100. Based on the model results, some of the elevation head at Vent 85 was converted to velocity head, causing an increase in the flow rate through the system. Once the fluid reached the low point, some of the velocity head was converted back to pressure head as the pipeline continued to fill. Based on this information, the team determined that the increase in fluid velocity lowered the upstream pressure, but the pressure at Vent 85 was not low enough to cause the vent valve to open.
- As the fluid moved up the pipeline past the 85-foot elevation and toward Vent 100, more of the pump head was converted to elevation head, resulting in a reduction of the flow rate within the system.
- As soon as the fluid reached Vent 100, it was at its maximum amount of static head. When the fluid began to flow through the down line, the flow rate in the system began to increase as the elevation head of the fluid was converted to velocity head. At 10.5 minutes into the test, the elevation of the flow stream in the down line increased the flow rate through the system high enough to cause cavitation in the backup pumps. At some point in the down line, the velocity of the fluid continued to increase so that the pressure in the pipeline dropped below the fluid’s vapor pressure, resulting in two-phase flow in the pipeline.
- As the velocity of the fluid continued to increase, the pressure decreased in the down pipe and activated the vacuum relief valve at Vent 100, allowing air in the pipeline. At this point, the down pipe was a vent with air and liquid mixed. In the vent lines, the interaction between the liquid and air slugs in the drain line caused large pressure transients that were transmitted throughout the system. That was why the pumps experienced excessive cavitation and vibration.
Providing solutions
Since pumping from a fully charged pipeline into a drain line with a large vertical drop, as in the system described, is not good practice, other solutions were explored.
Adding a tank at Vent 100
One solution was to separate the existing system by installing a divided tank at Vent 100. The pump system would fill one side of the divided tank until full then overflow to the other tank. This approach would remove all the noise and vibration in the backup pumps.
A vent line would be connected to the other side of the divided tank. The vent line would need to be adequately sized and properly vented to avoid damage to this part of the system. Drain lines were outside the scope of the simulation.
Filling the down pipe
Another option was to modify the down pipe so it remained full at the designed flow rate. This could be done by inserting a restriction in the down pipe to remove the excess fluid energy not provided because of friction.
The winning solution
Using the simulator, the team decided to proceed with a third option and limit the flow in the system to 7,000 gallons per minute (gpm). With that flow rate the pumps would be able to deliver 70.32 feet of head. With 7,000 gpm in the down pipe, the head loss would be 25.64 feet. To limit the flow in the down pipe to 7,000 gpm, the addition of 48.68 feet of head would be required and could be achieved by either reducing the diameter of the down pipe to increase friction, inserting a nozzle or restriction orifice into the pipeline, or installing a control valve to dissipate the excess energy.
Conclusion
Using wireless technology and simulation software provided a way to troubleshoot the system and gain a better understanding of the root cause of the noise and vibration associated with the recently added backup pumps. The system was designed with minimal installed instrumentation, but by using the piping system model, determining the sequence of events of the onset of noise and vibration, and verifying the position of vent valves, the team determined the source of the problem and simulated and evaluated viable options for solving the problem.
Ray T. Hardee, P.E., is the chief engineer and a principle founder of Engineered Software Inc., creators of PIPE-FLO and PUMP-FLO® software. The PIPE-FLO product line helps companies across many industries find hidden profit in the design and operation of their fluid piping systems through simulation software, modeling services and training opportunities. Hardee is a member of the Hydraulic Institute (HI), American Society of Mechanical Engineers’ Energy Assessment for Pumping Systems standards committee and the International Organization for Standardization’s Pumping System Energy Assessment committee. His publications include Piping System Fundamentals and contributions to HI’s Pump Life Cycle Cost and Optimizing Piping Systems. He may be reached at [email protected].
Jeremy Frank, Ph.D., is the president and cofounder of KCF Technologies Inc., an engineering technology company that develops and integrates innovative devices for use in the emerging world of the Internet of Things. Frank earned an MBA and a doctorate in mechanical engineering from the Center for Acoustics and Vibration at Pennsylvania State University, researching smart material devices and actuators. Founded in 2000, KCF provides wireless condition monitoring sensor systems for defense and industrial markets based on vibration sensing technologies. KCF has achieved successes in multiple industries such as pulp and paper, oil and gas, automotive, and food and beverage products as well as institutional building sectors.
Engineered Software Inc. – http://www.eng-software.com
KCF Technologies Inc. – http://www.kcftech.com